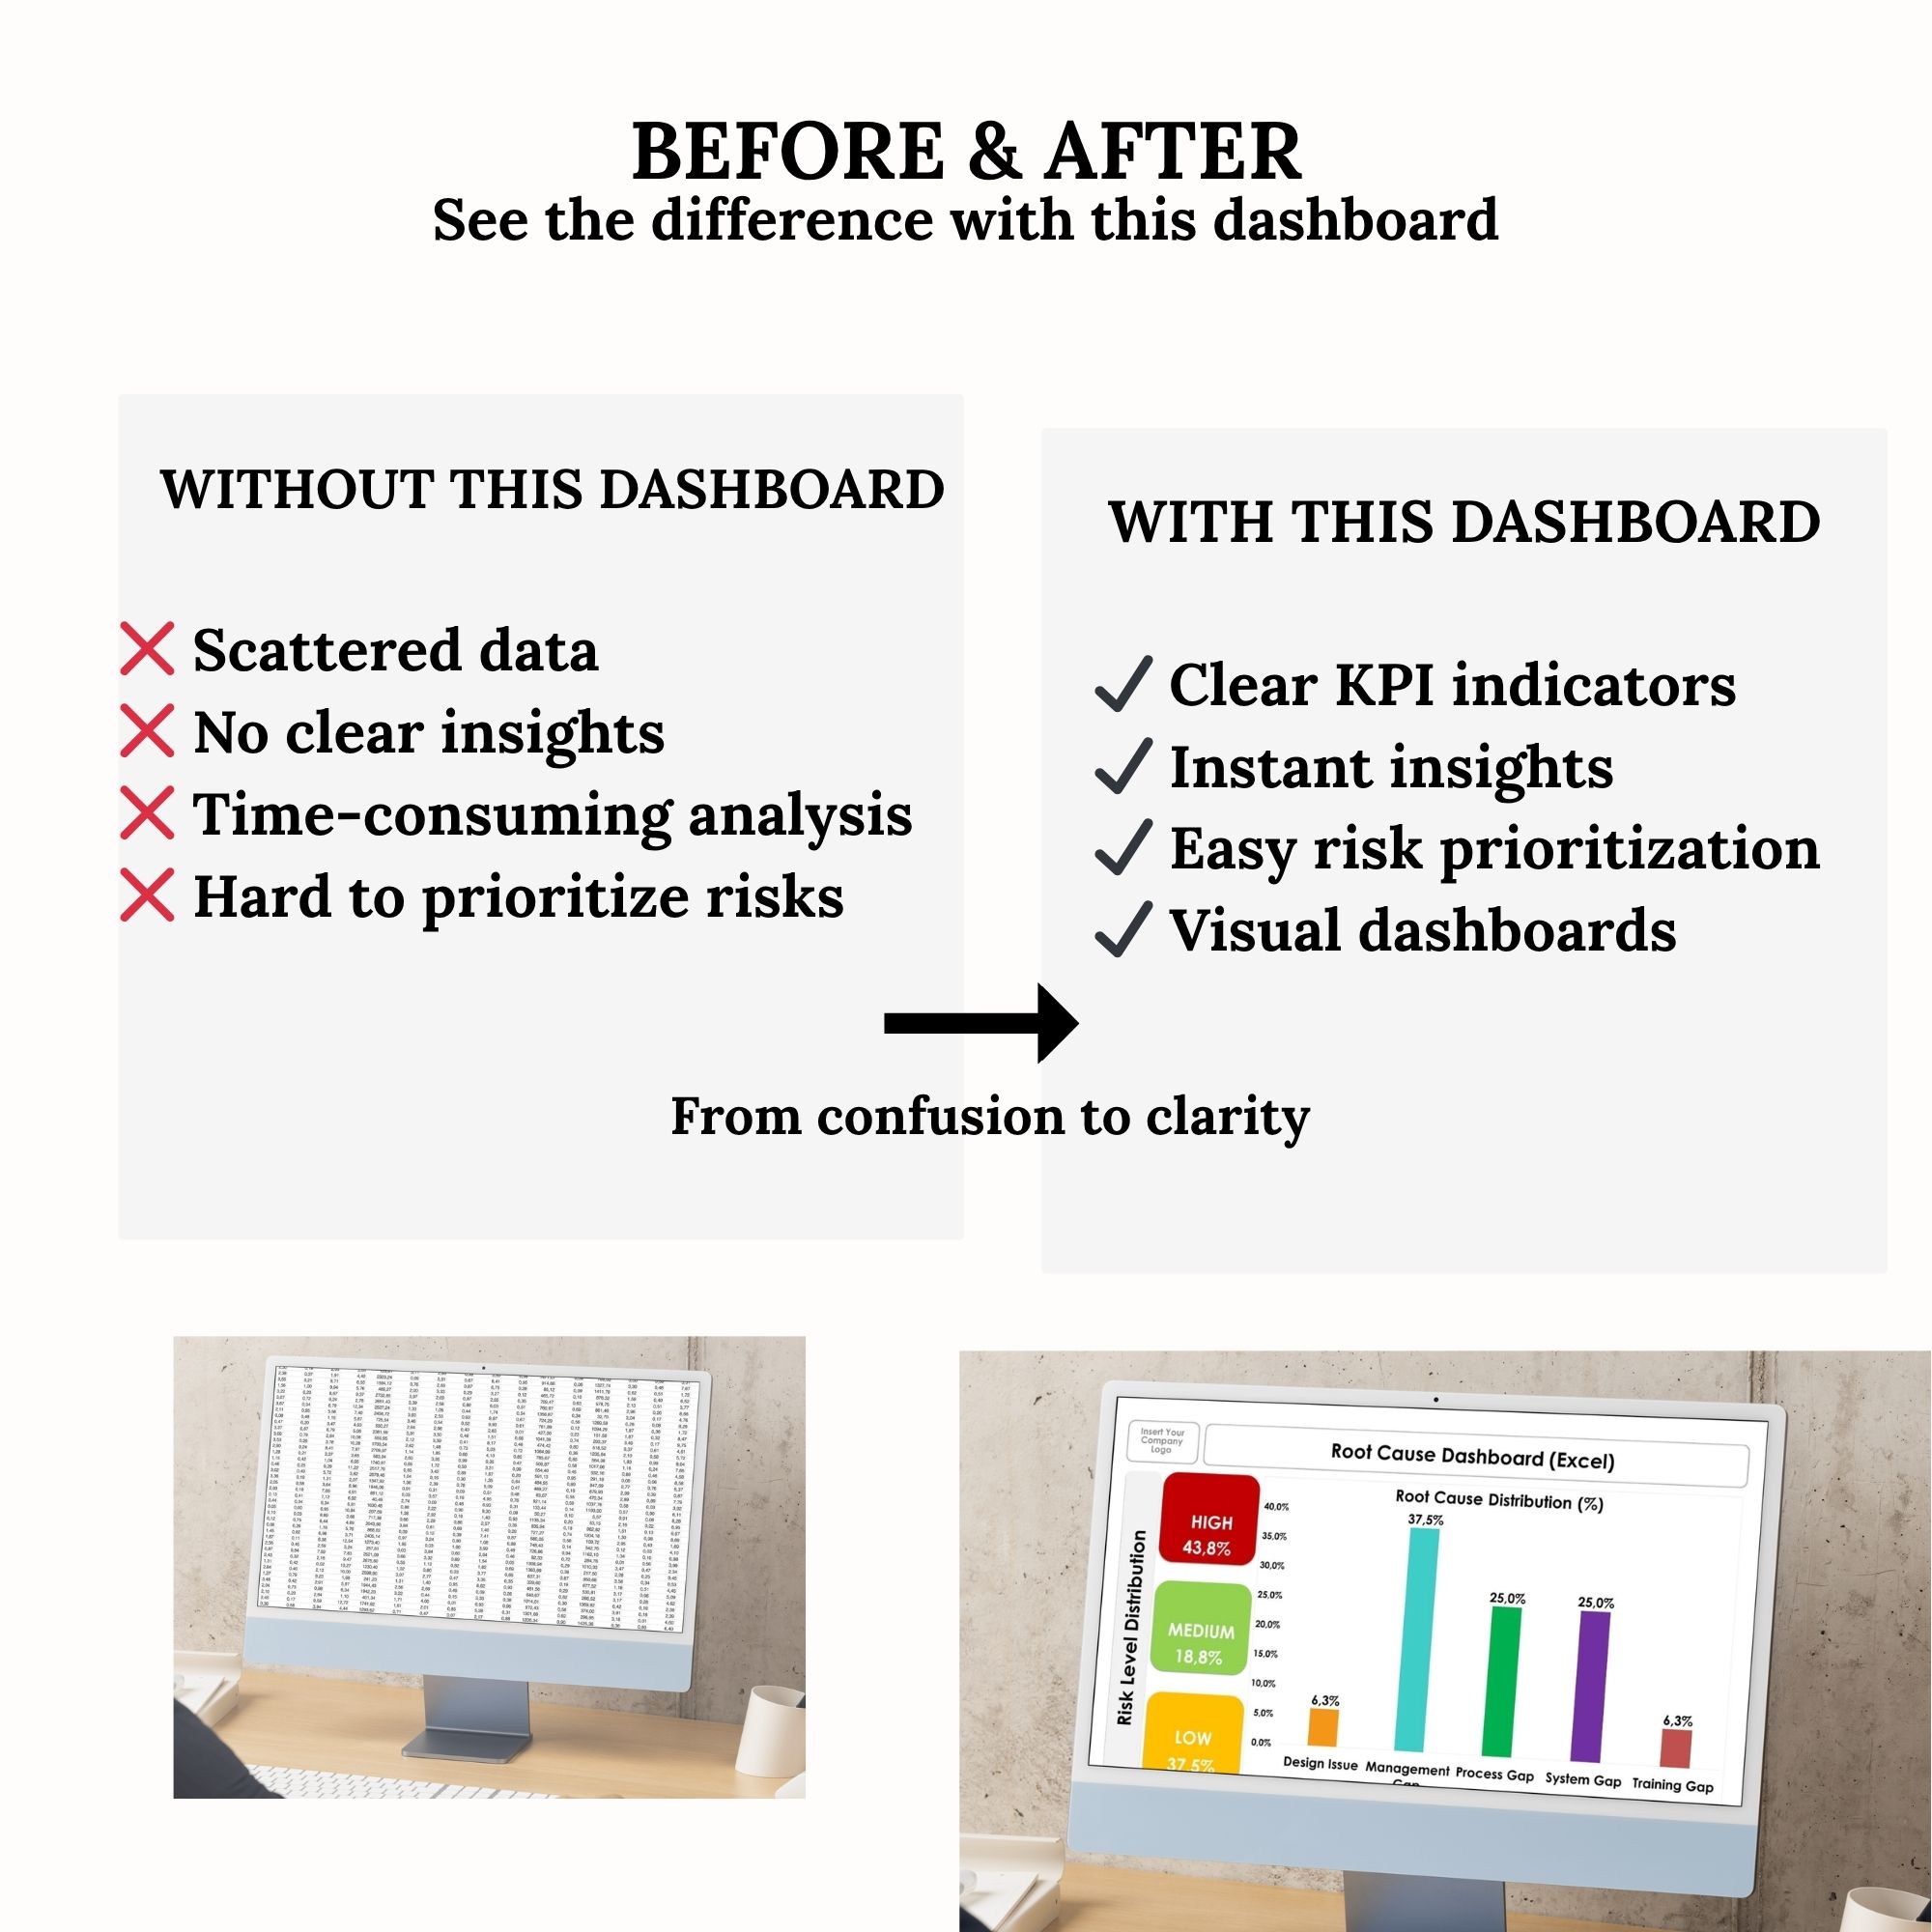

**Turn complex data into clear, actionable insights with this powerful Root Cause Analysis Excel Dashboard.**
Designed for quality professionals, operations teams, and process improvement specialists, this all-in-one Excel template helps you track issues, analyze root causes, calculate Risk Priority Numbers (RPN), and visualize results instantly.
No complicated setup. No macros. Just a clean, automated workflow.
—
### 🚀 KEY FEATURES
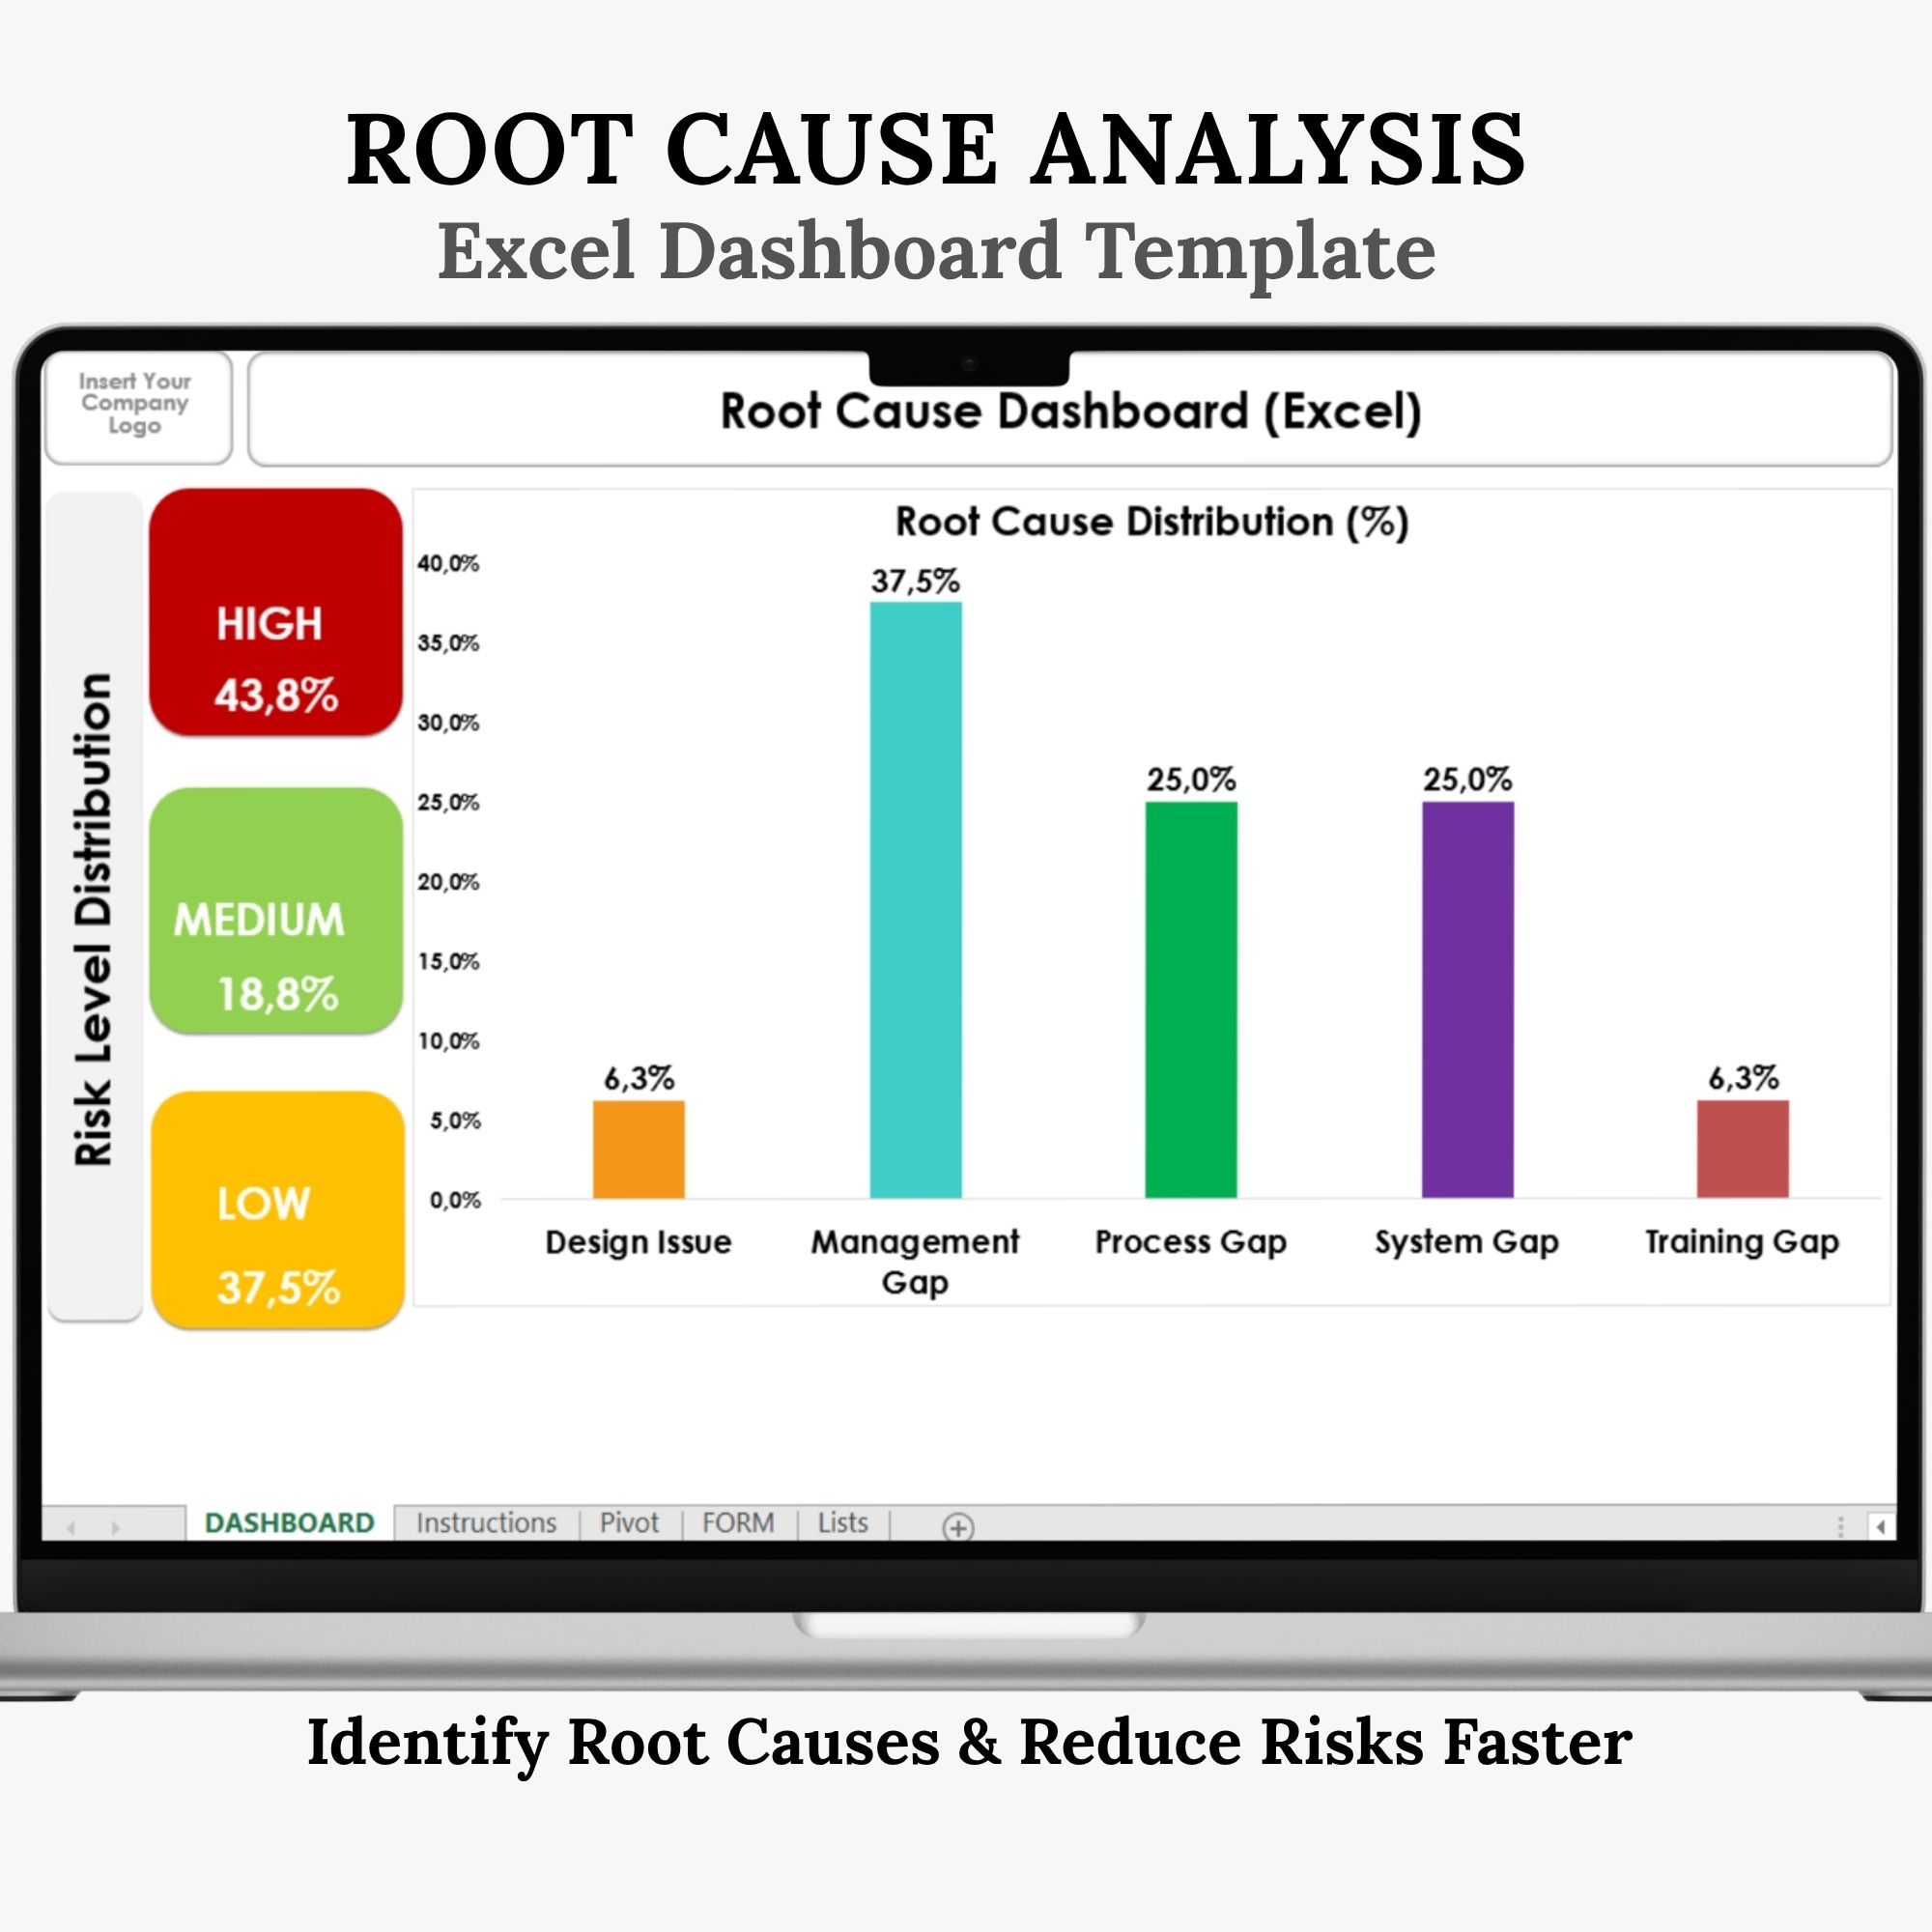
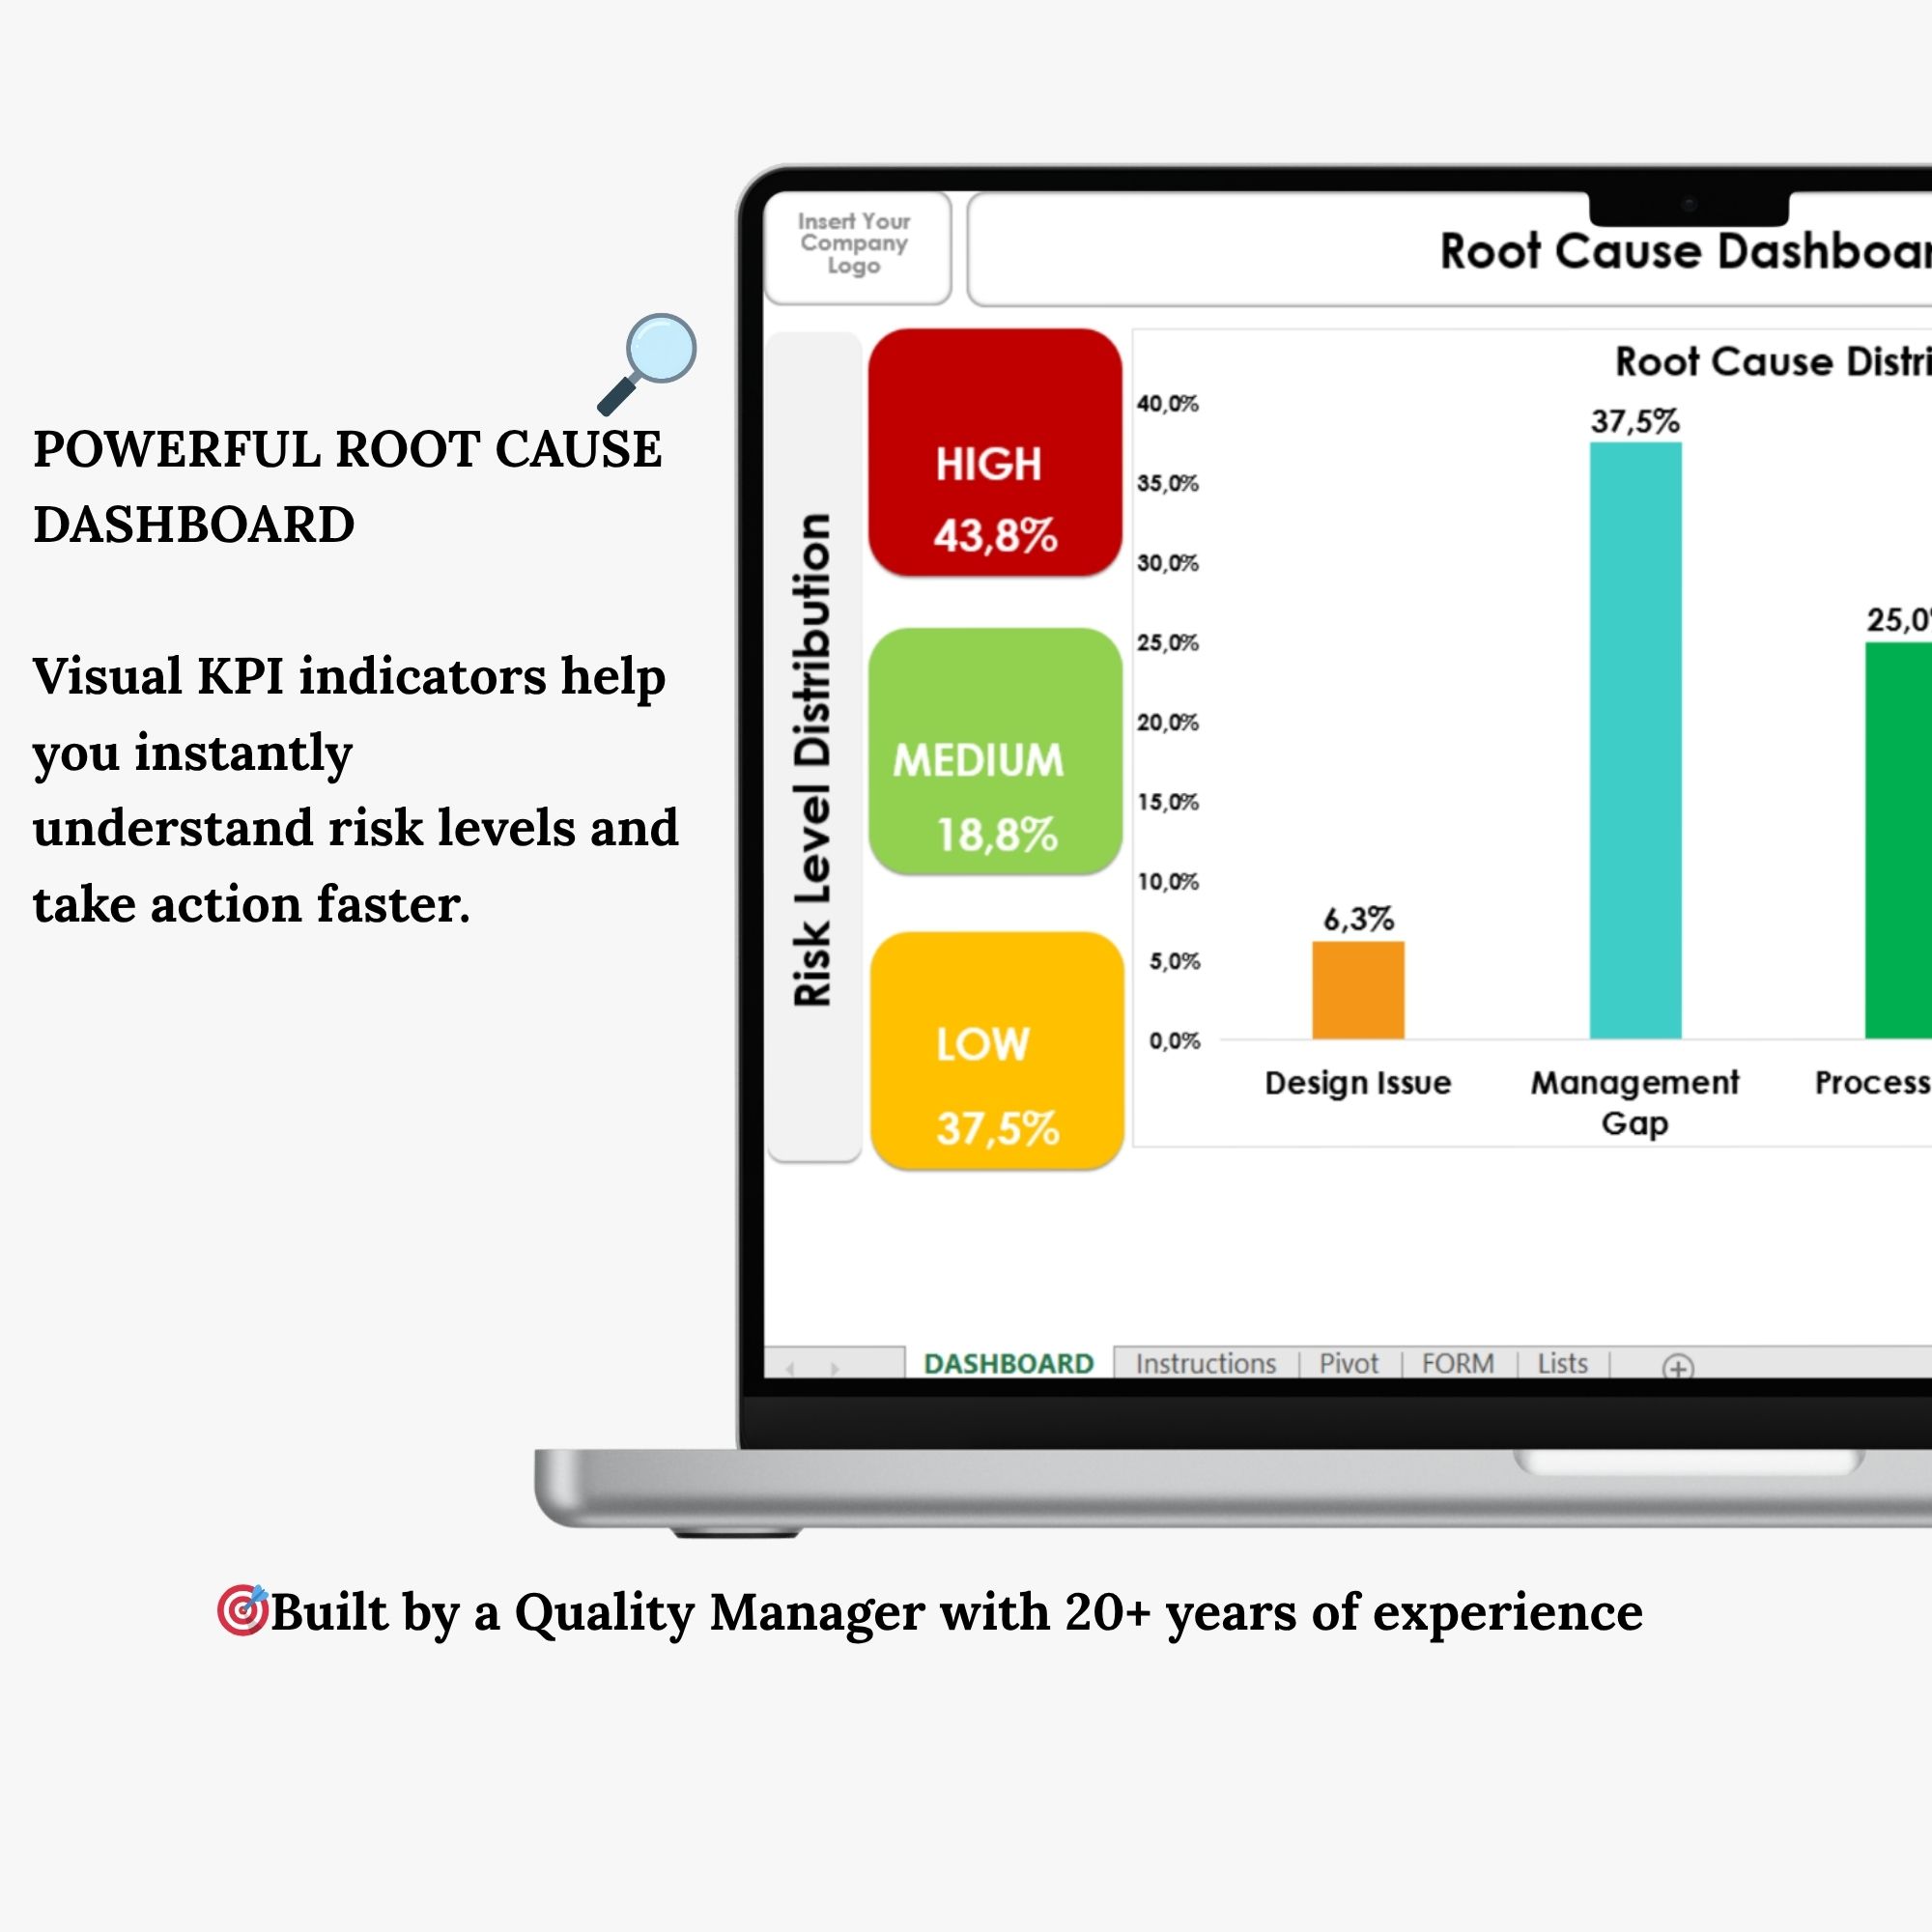
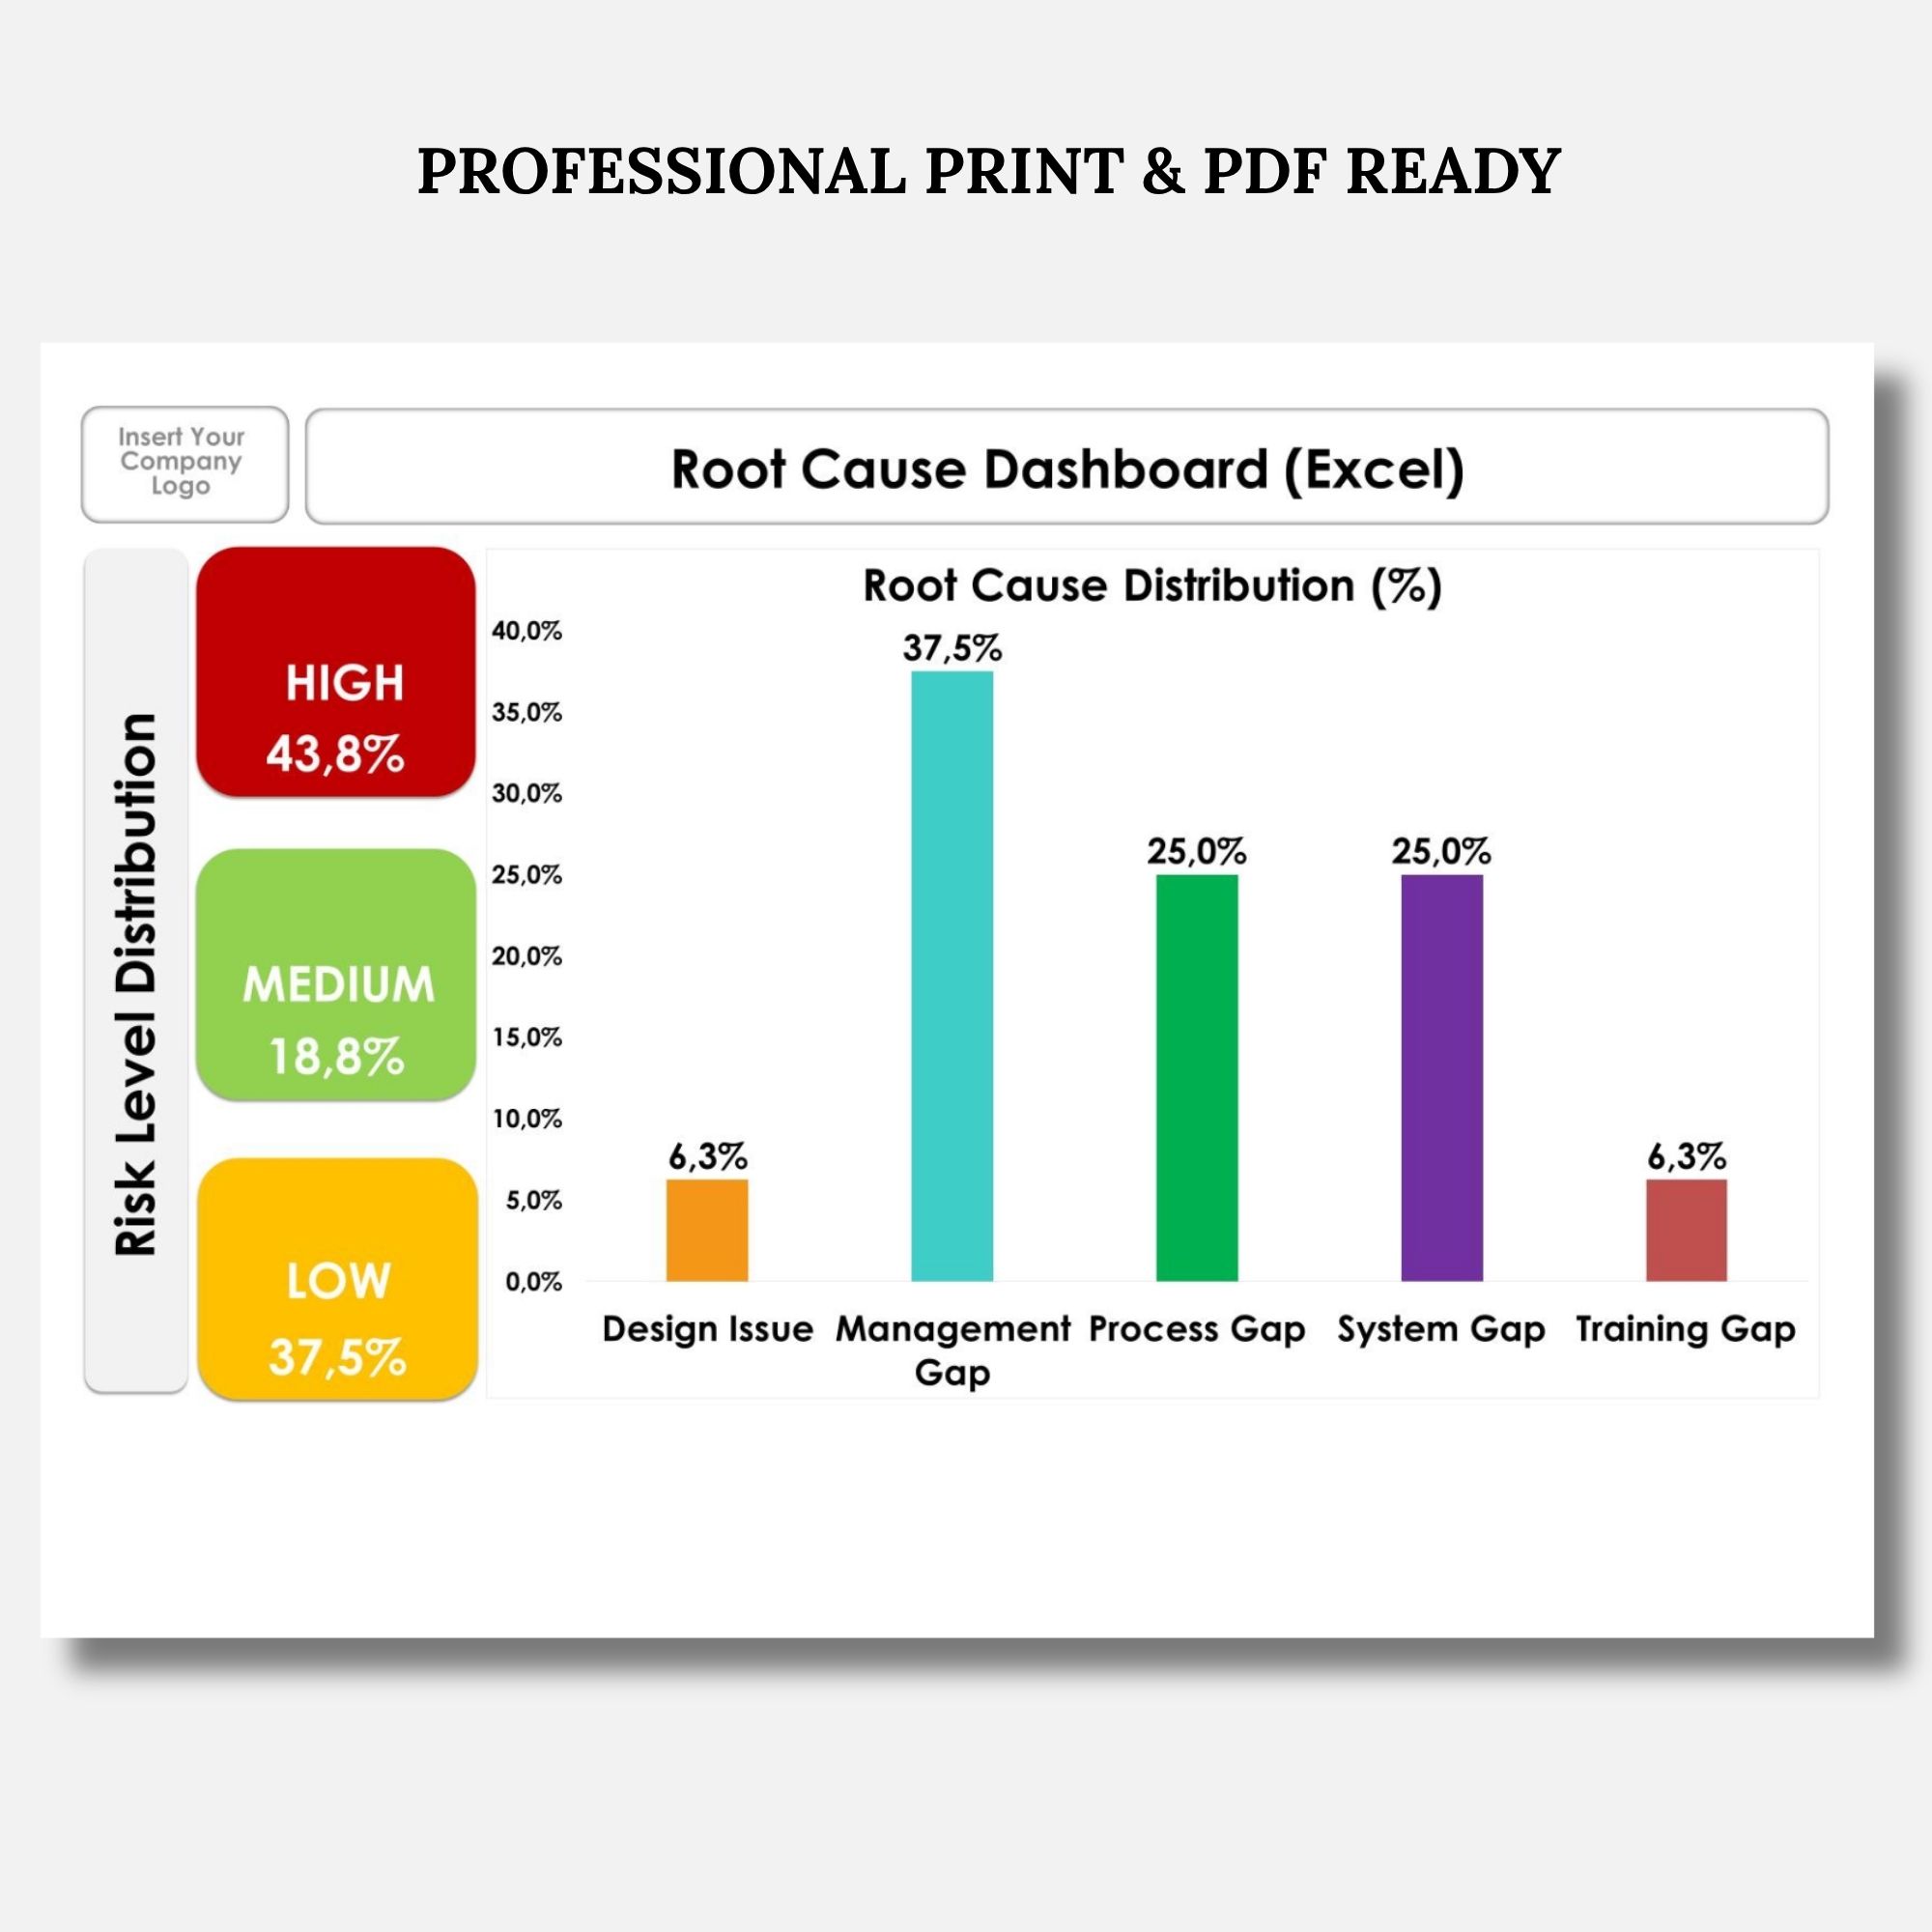
✔ Visual KPI indicators (HIGH / MEDIUM / LOW risk levels)
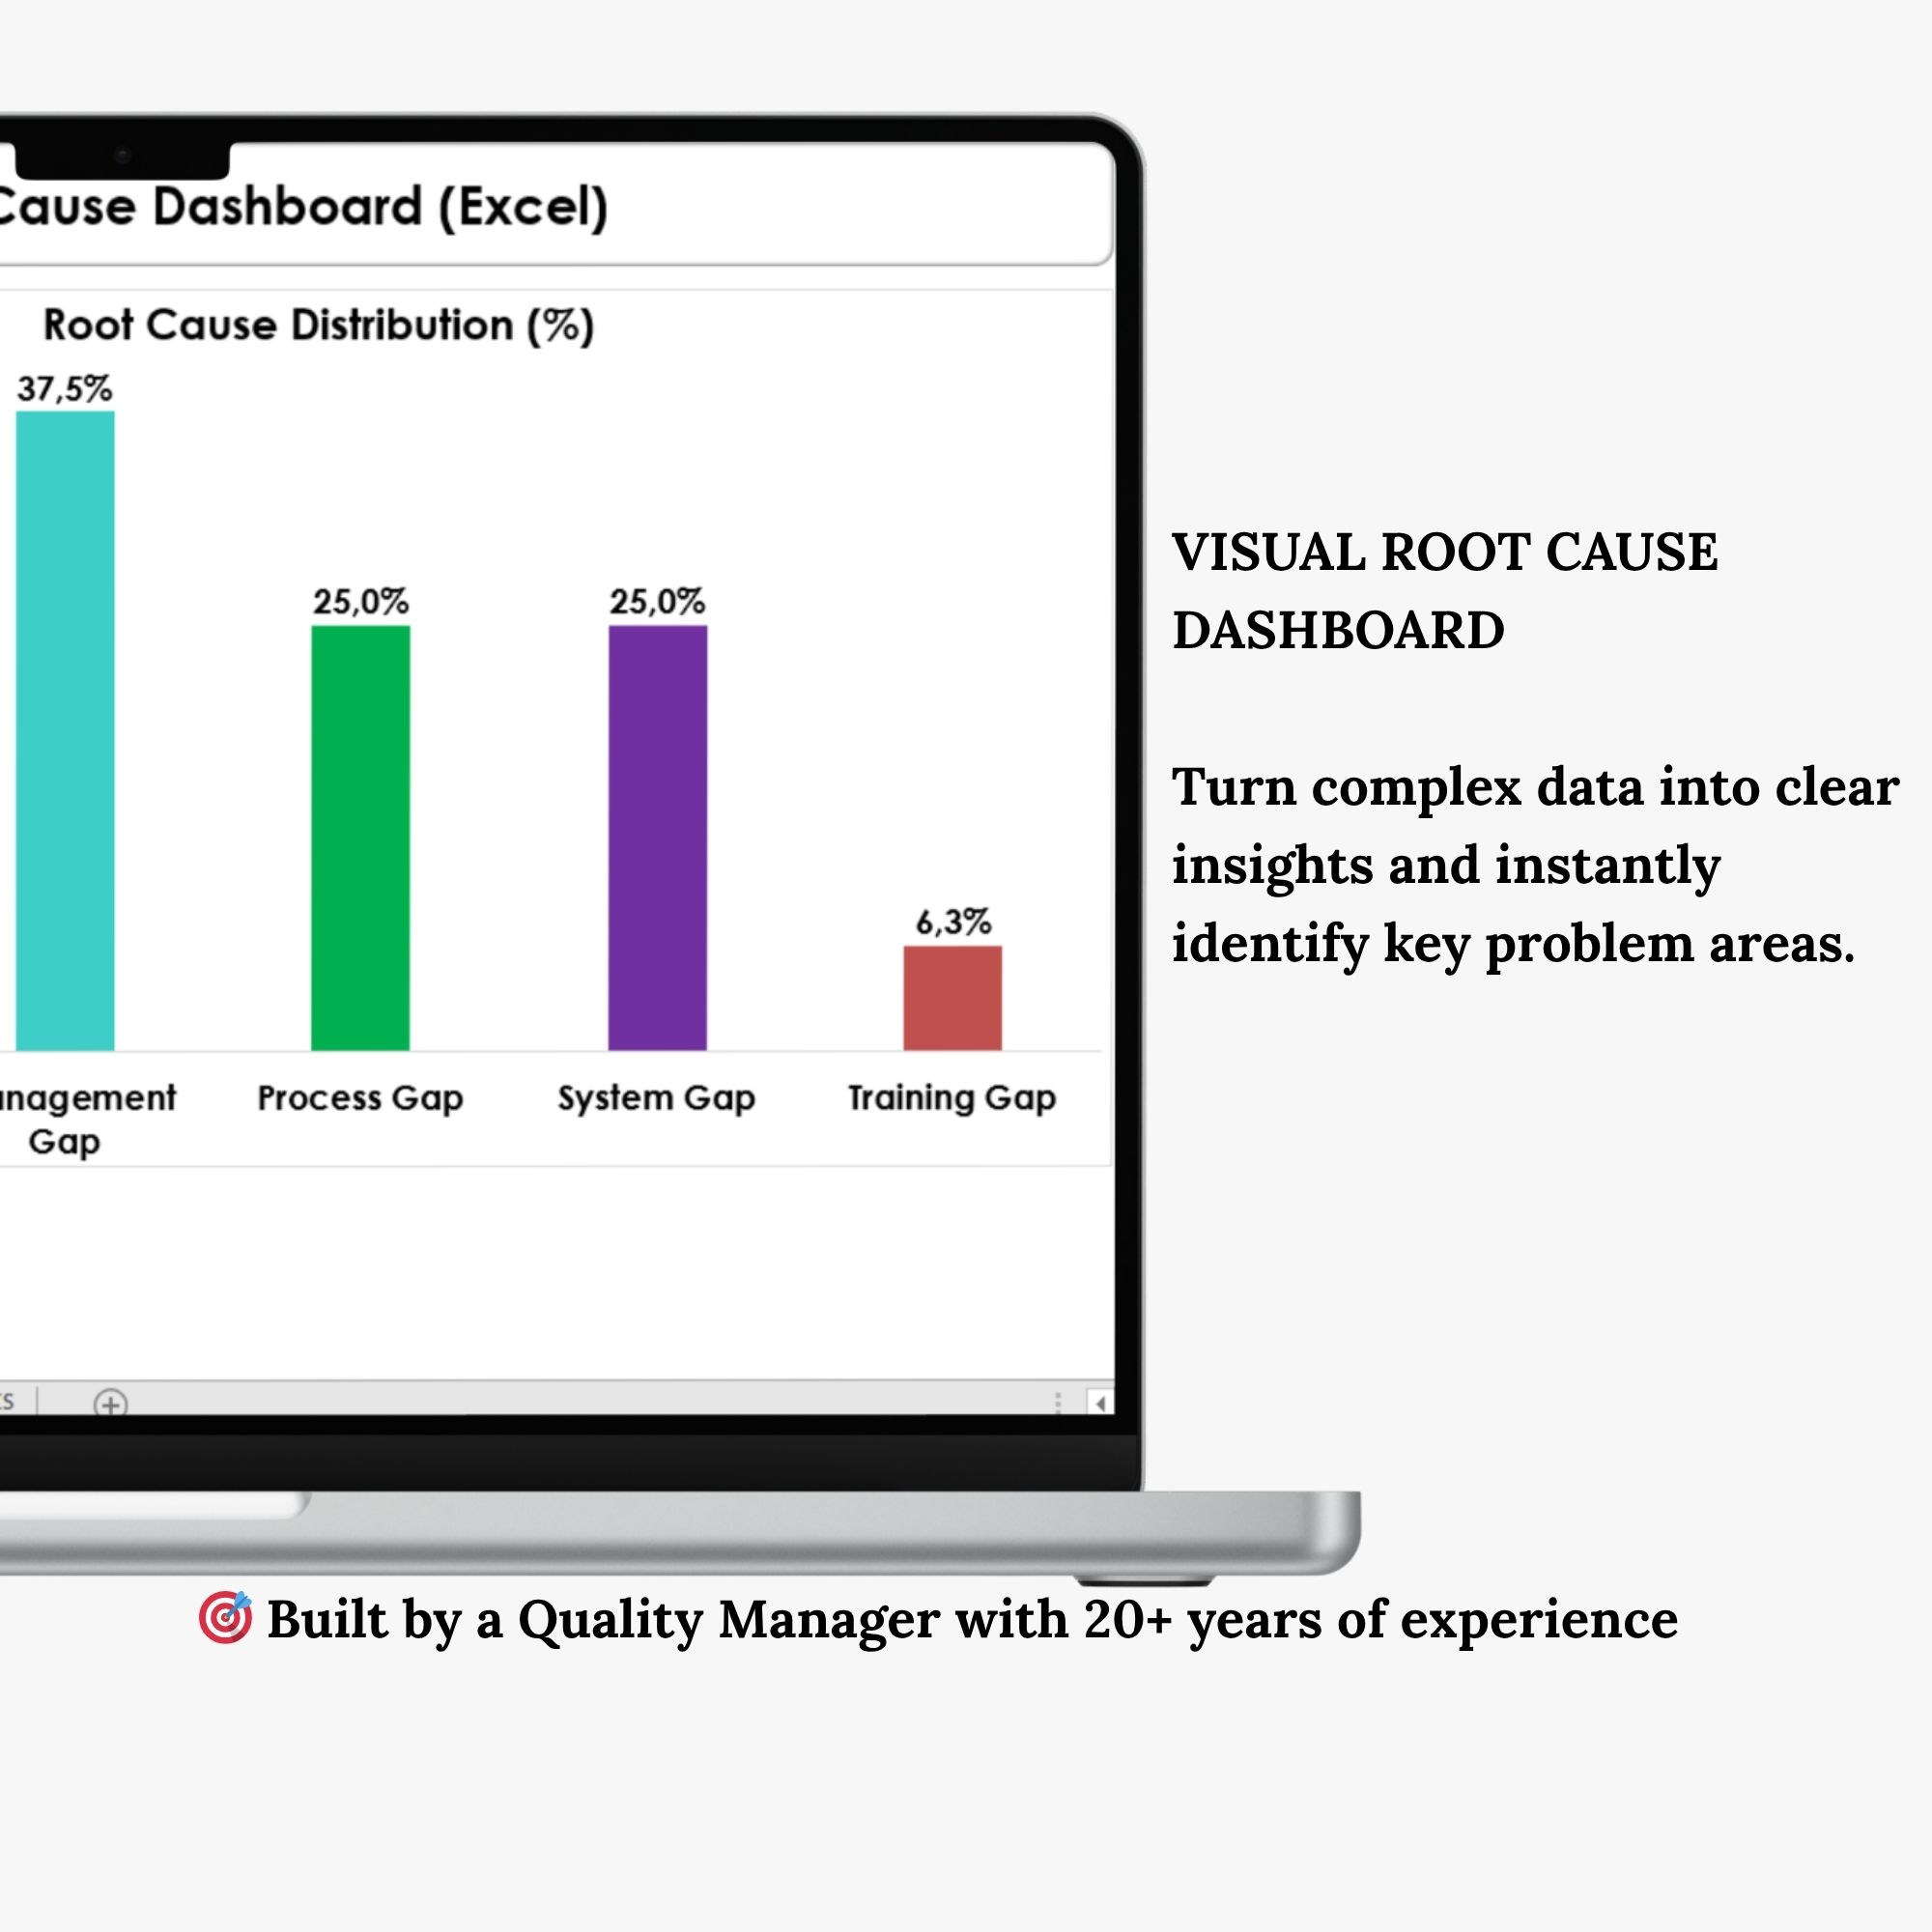
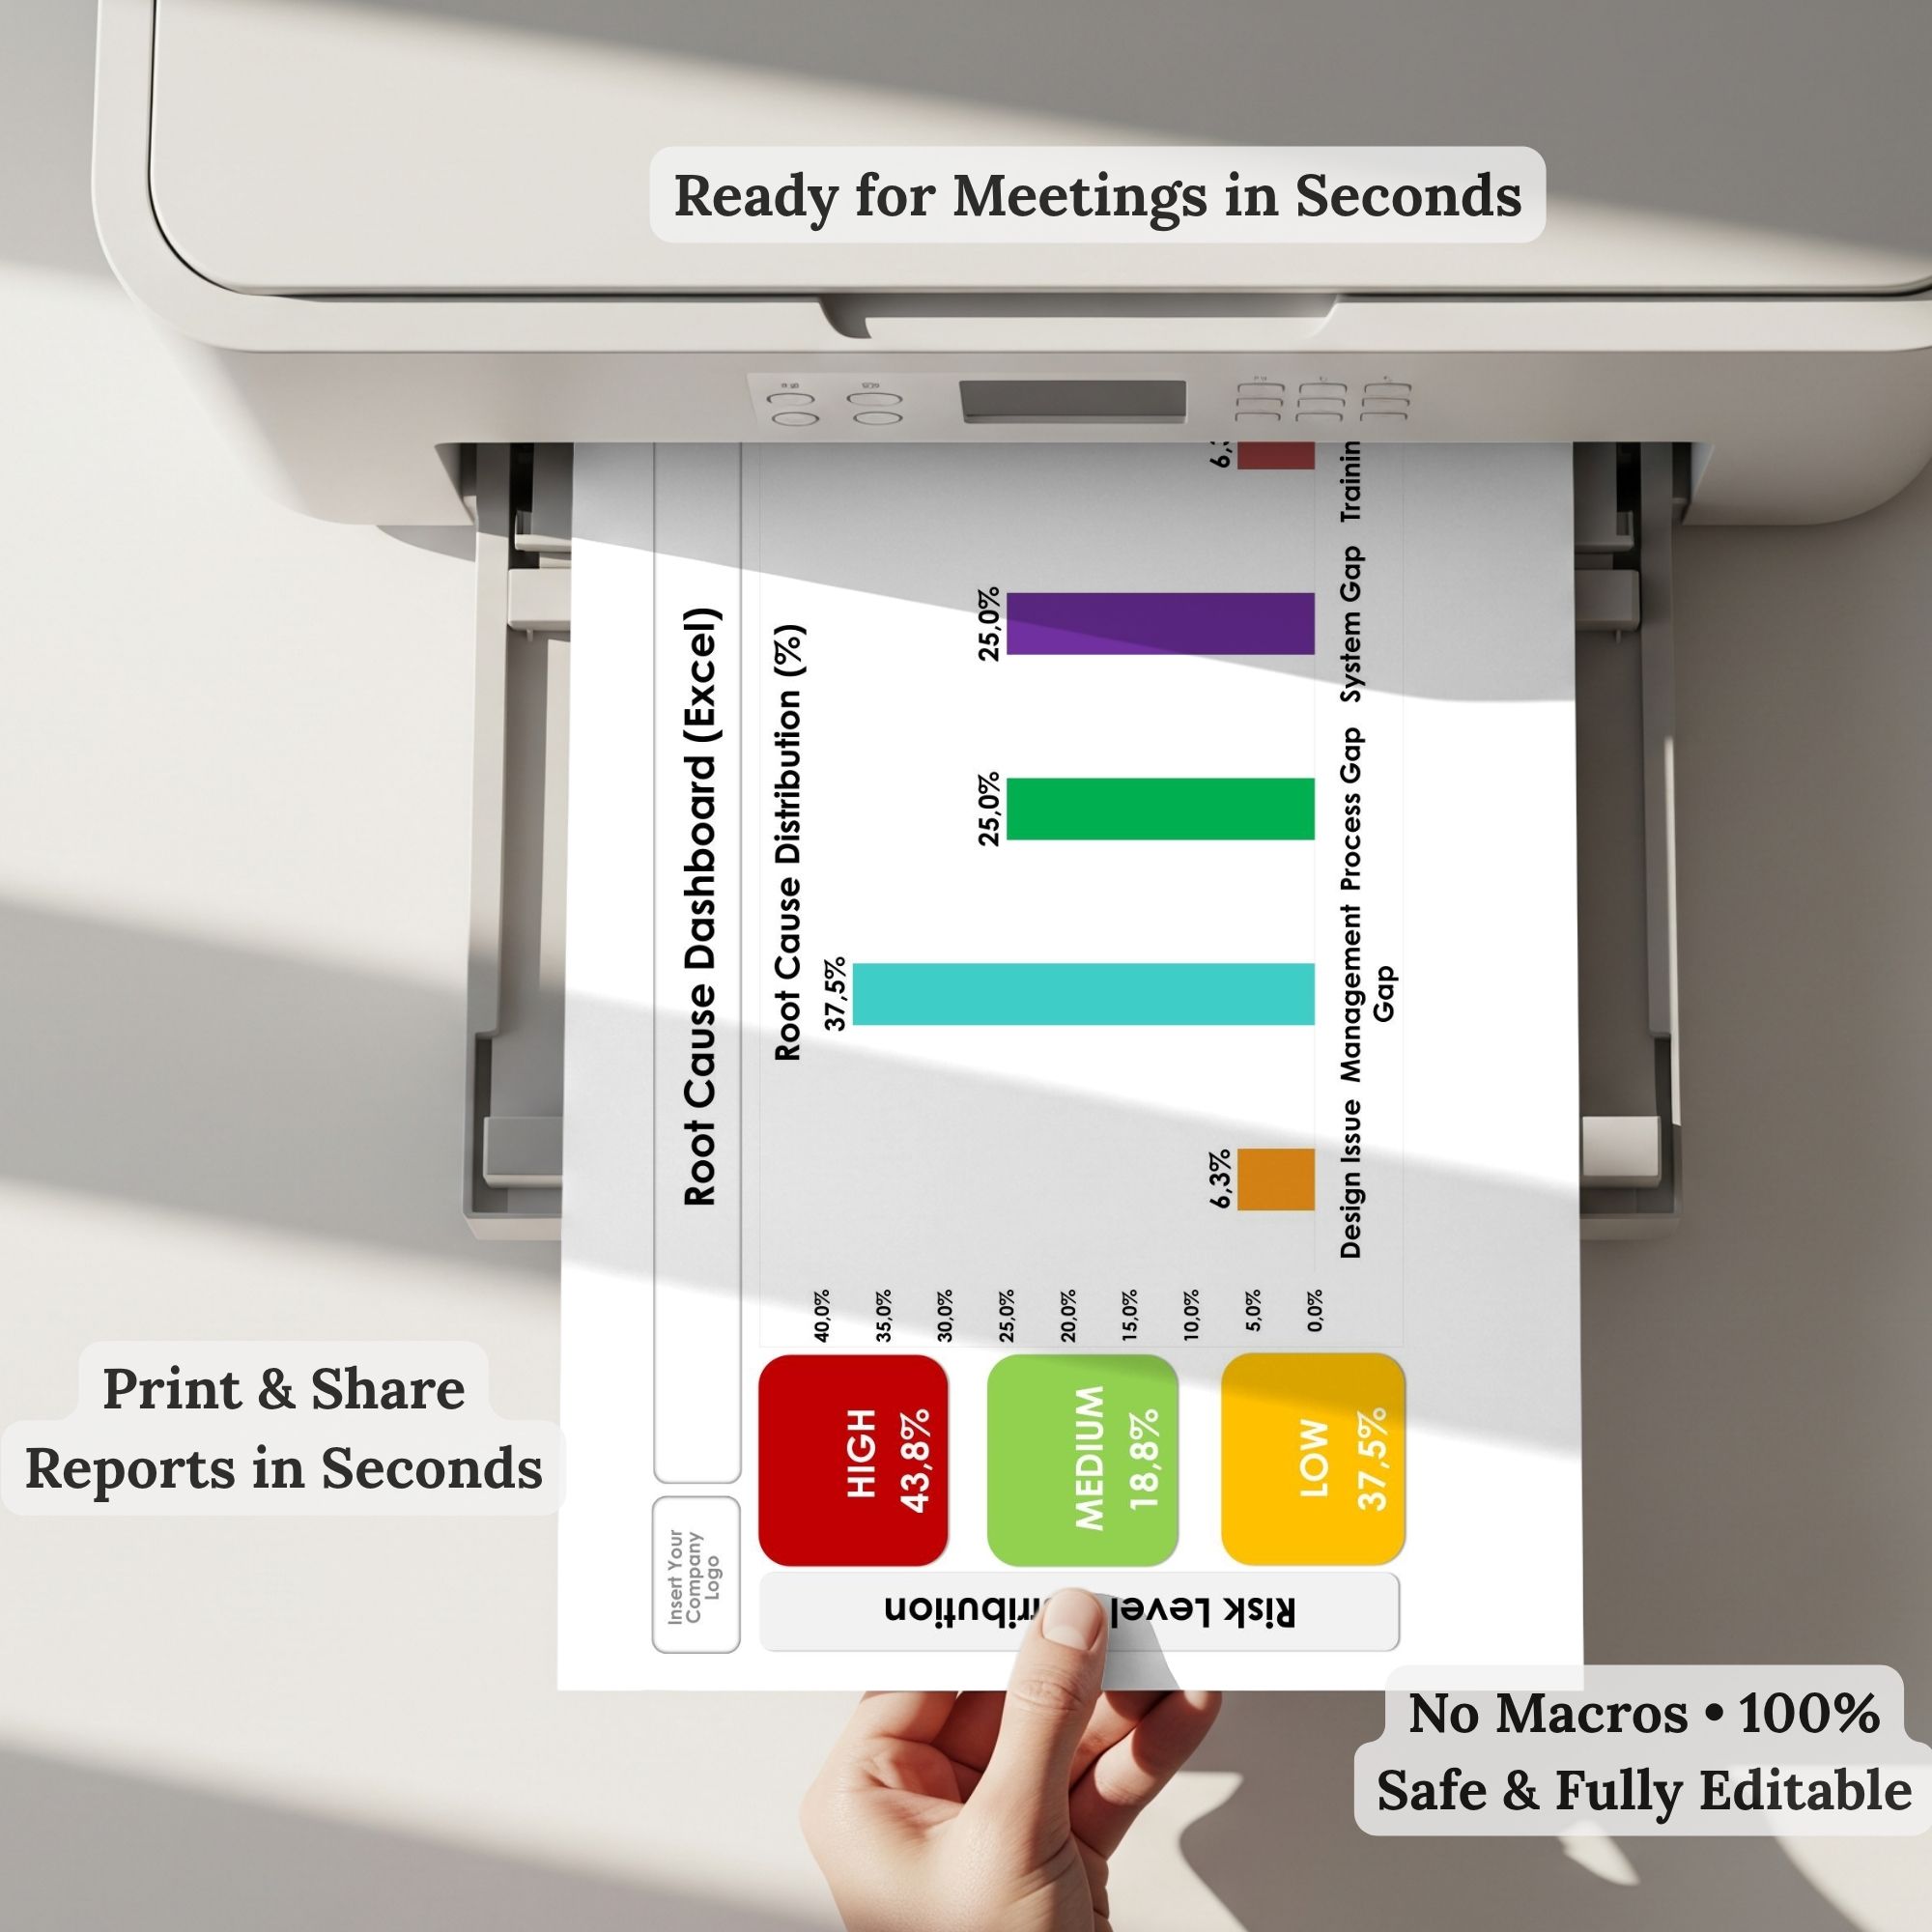
✔ Automated dashboard with dynamic charts
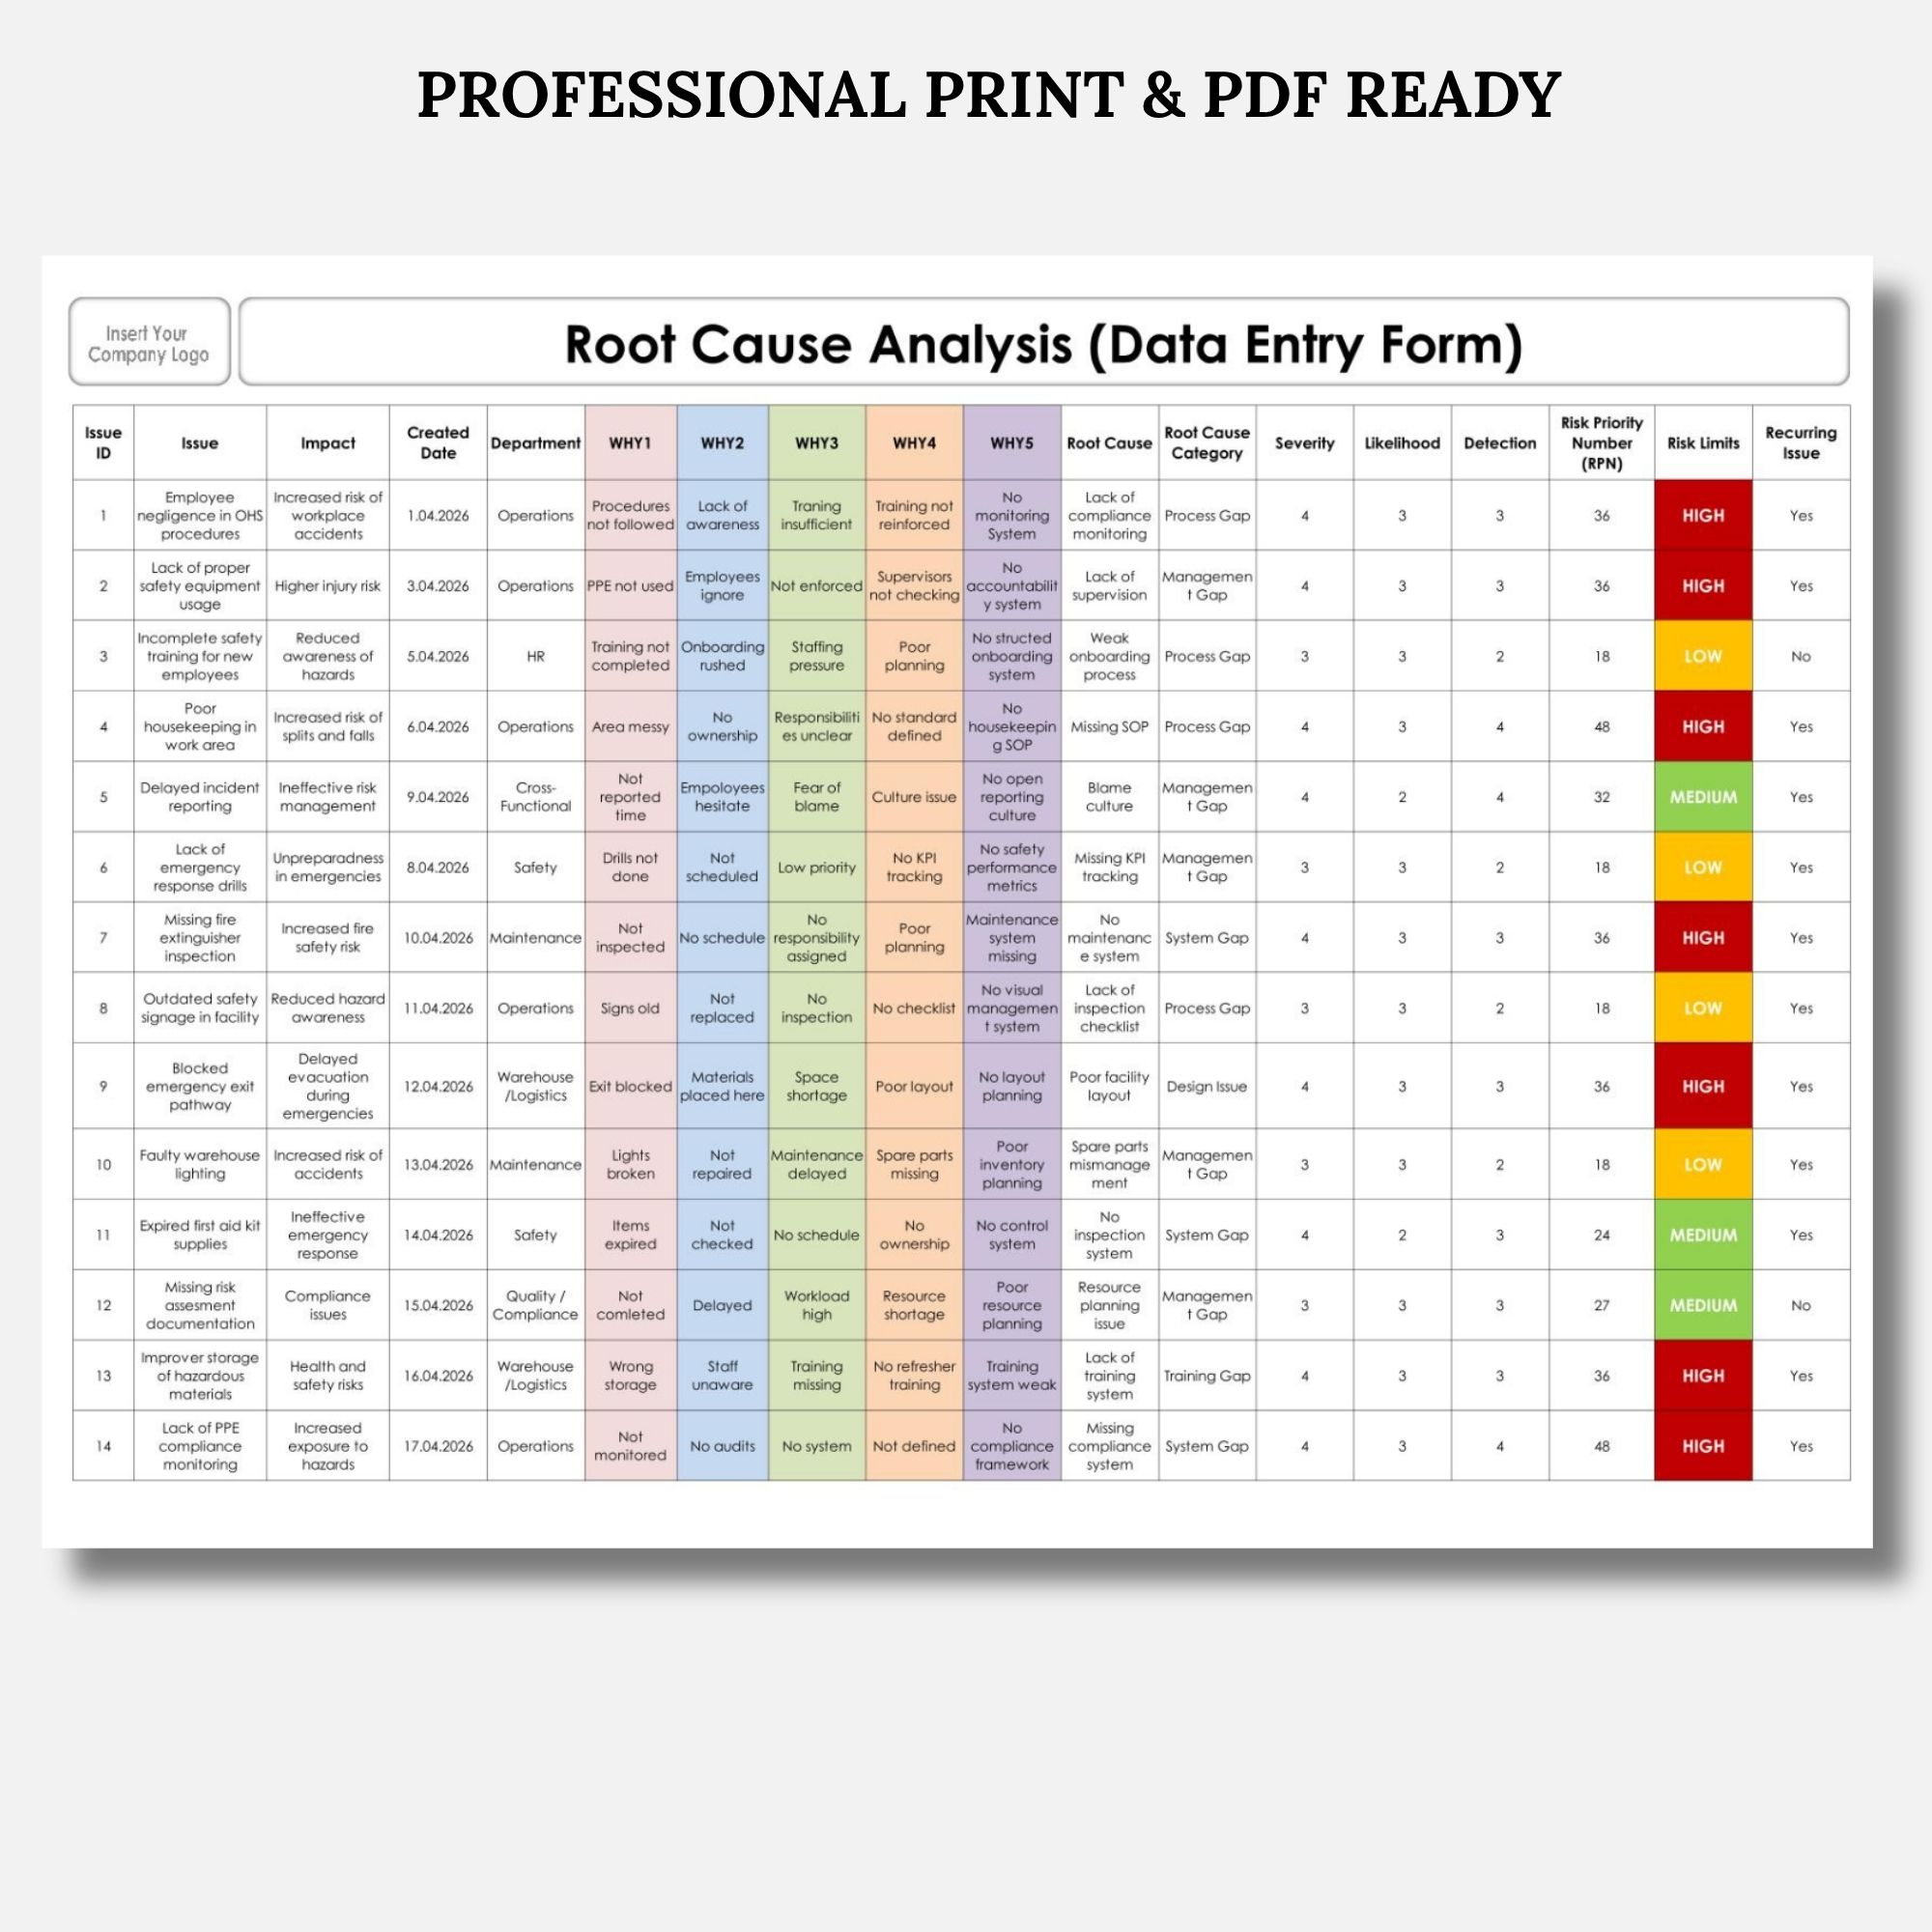
✔ Built-in RPN (Risk Priority Number) calculation
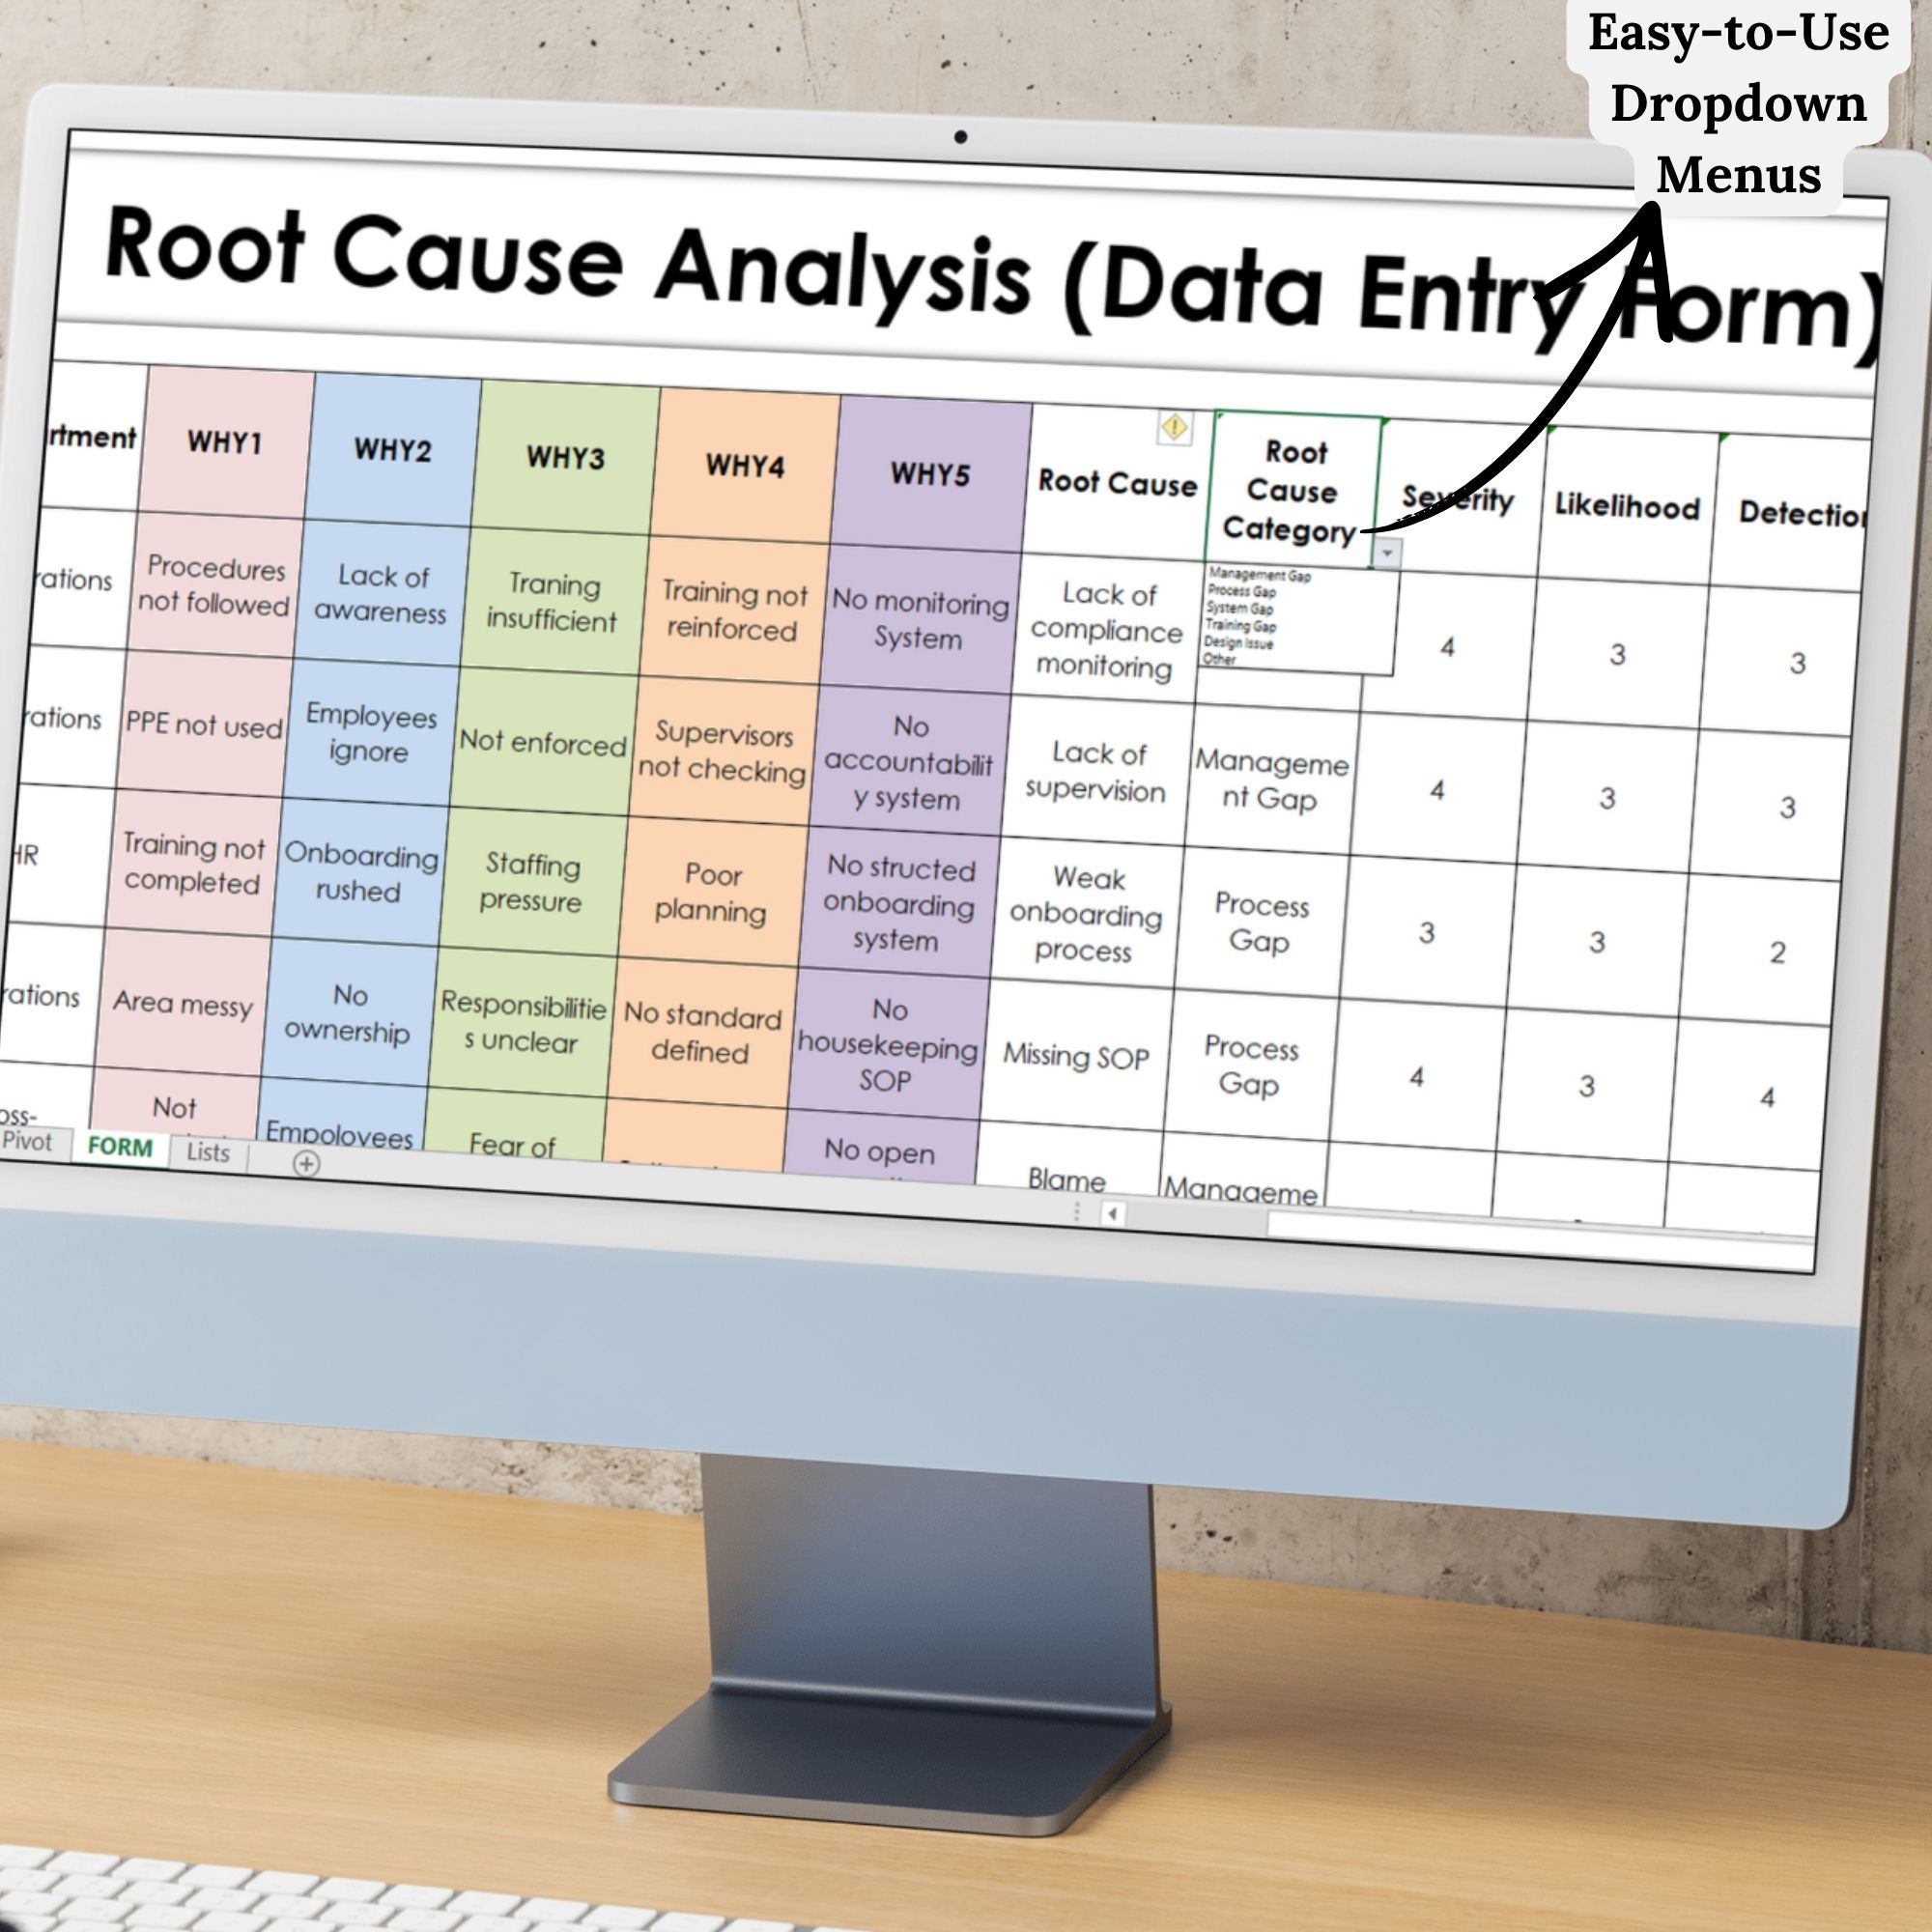
✔ Structured WHY1–WHY5 root cause analysis method
✔ One-click pivot refresh
✔ Fully editable and customizable
—
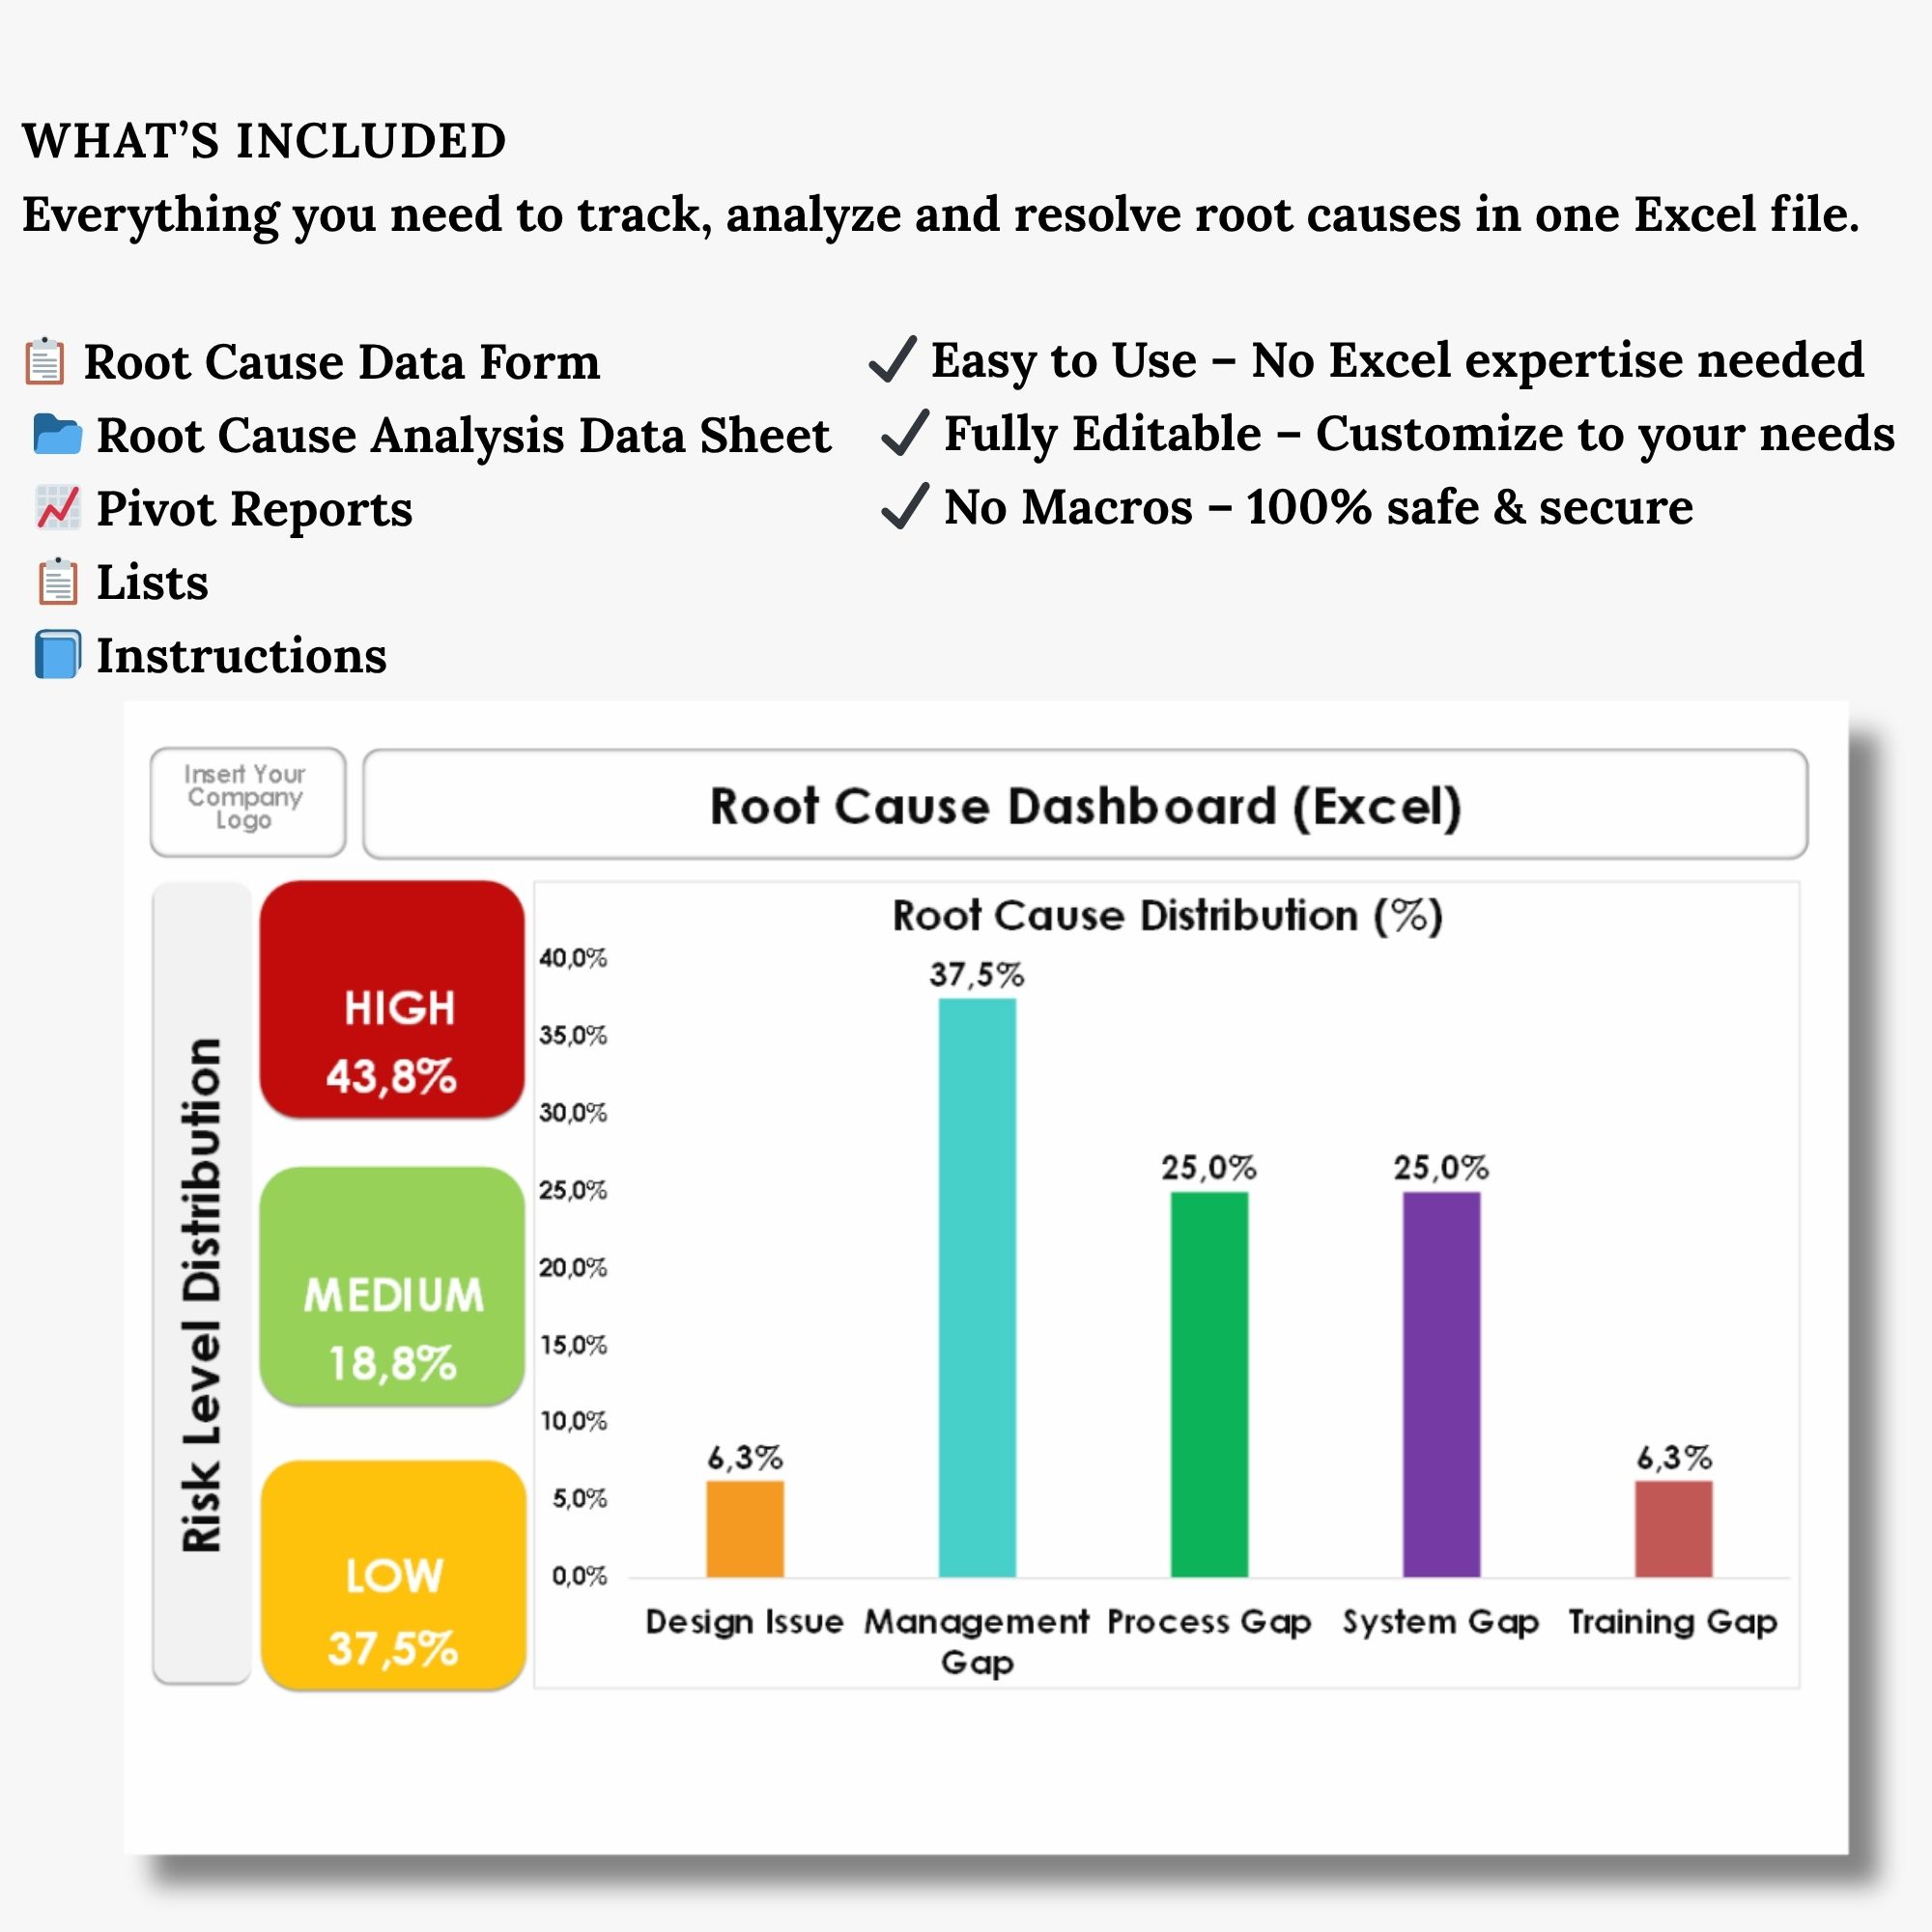
### 📊 WHAT’S INCLUDED
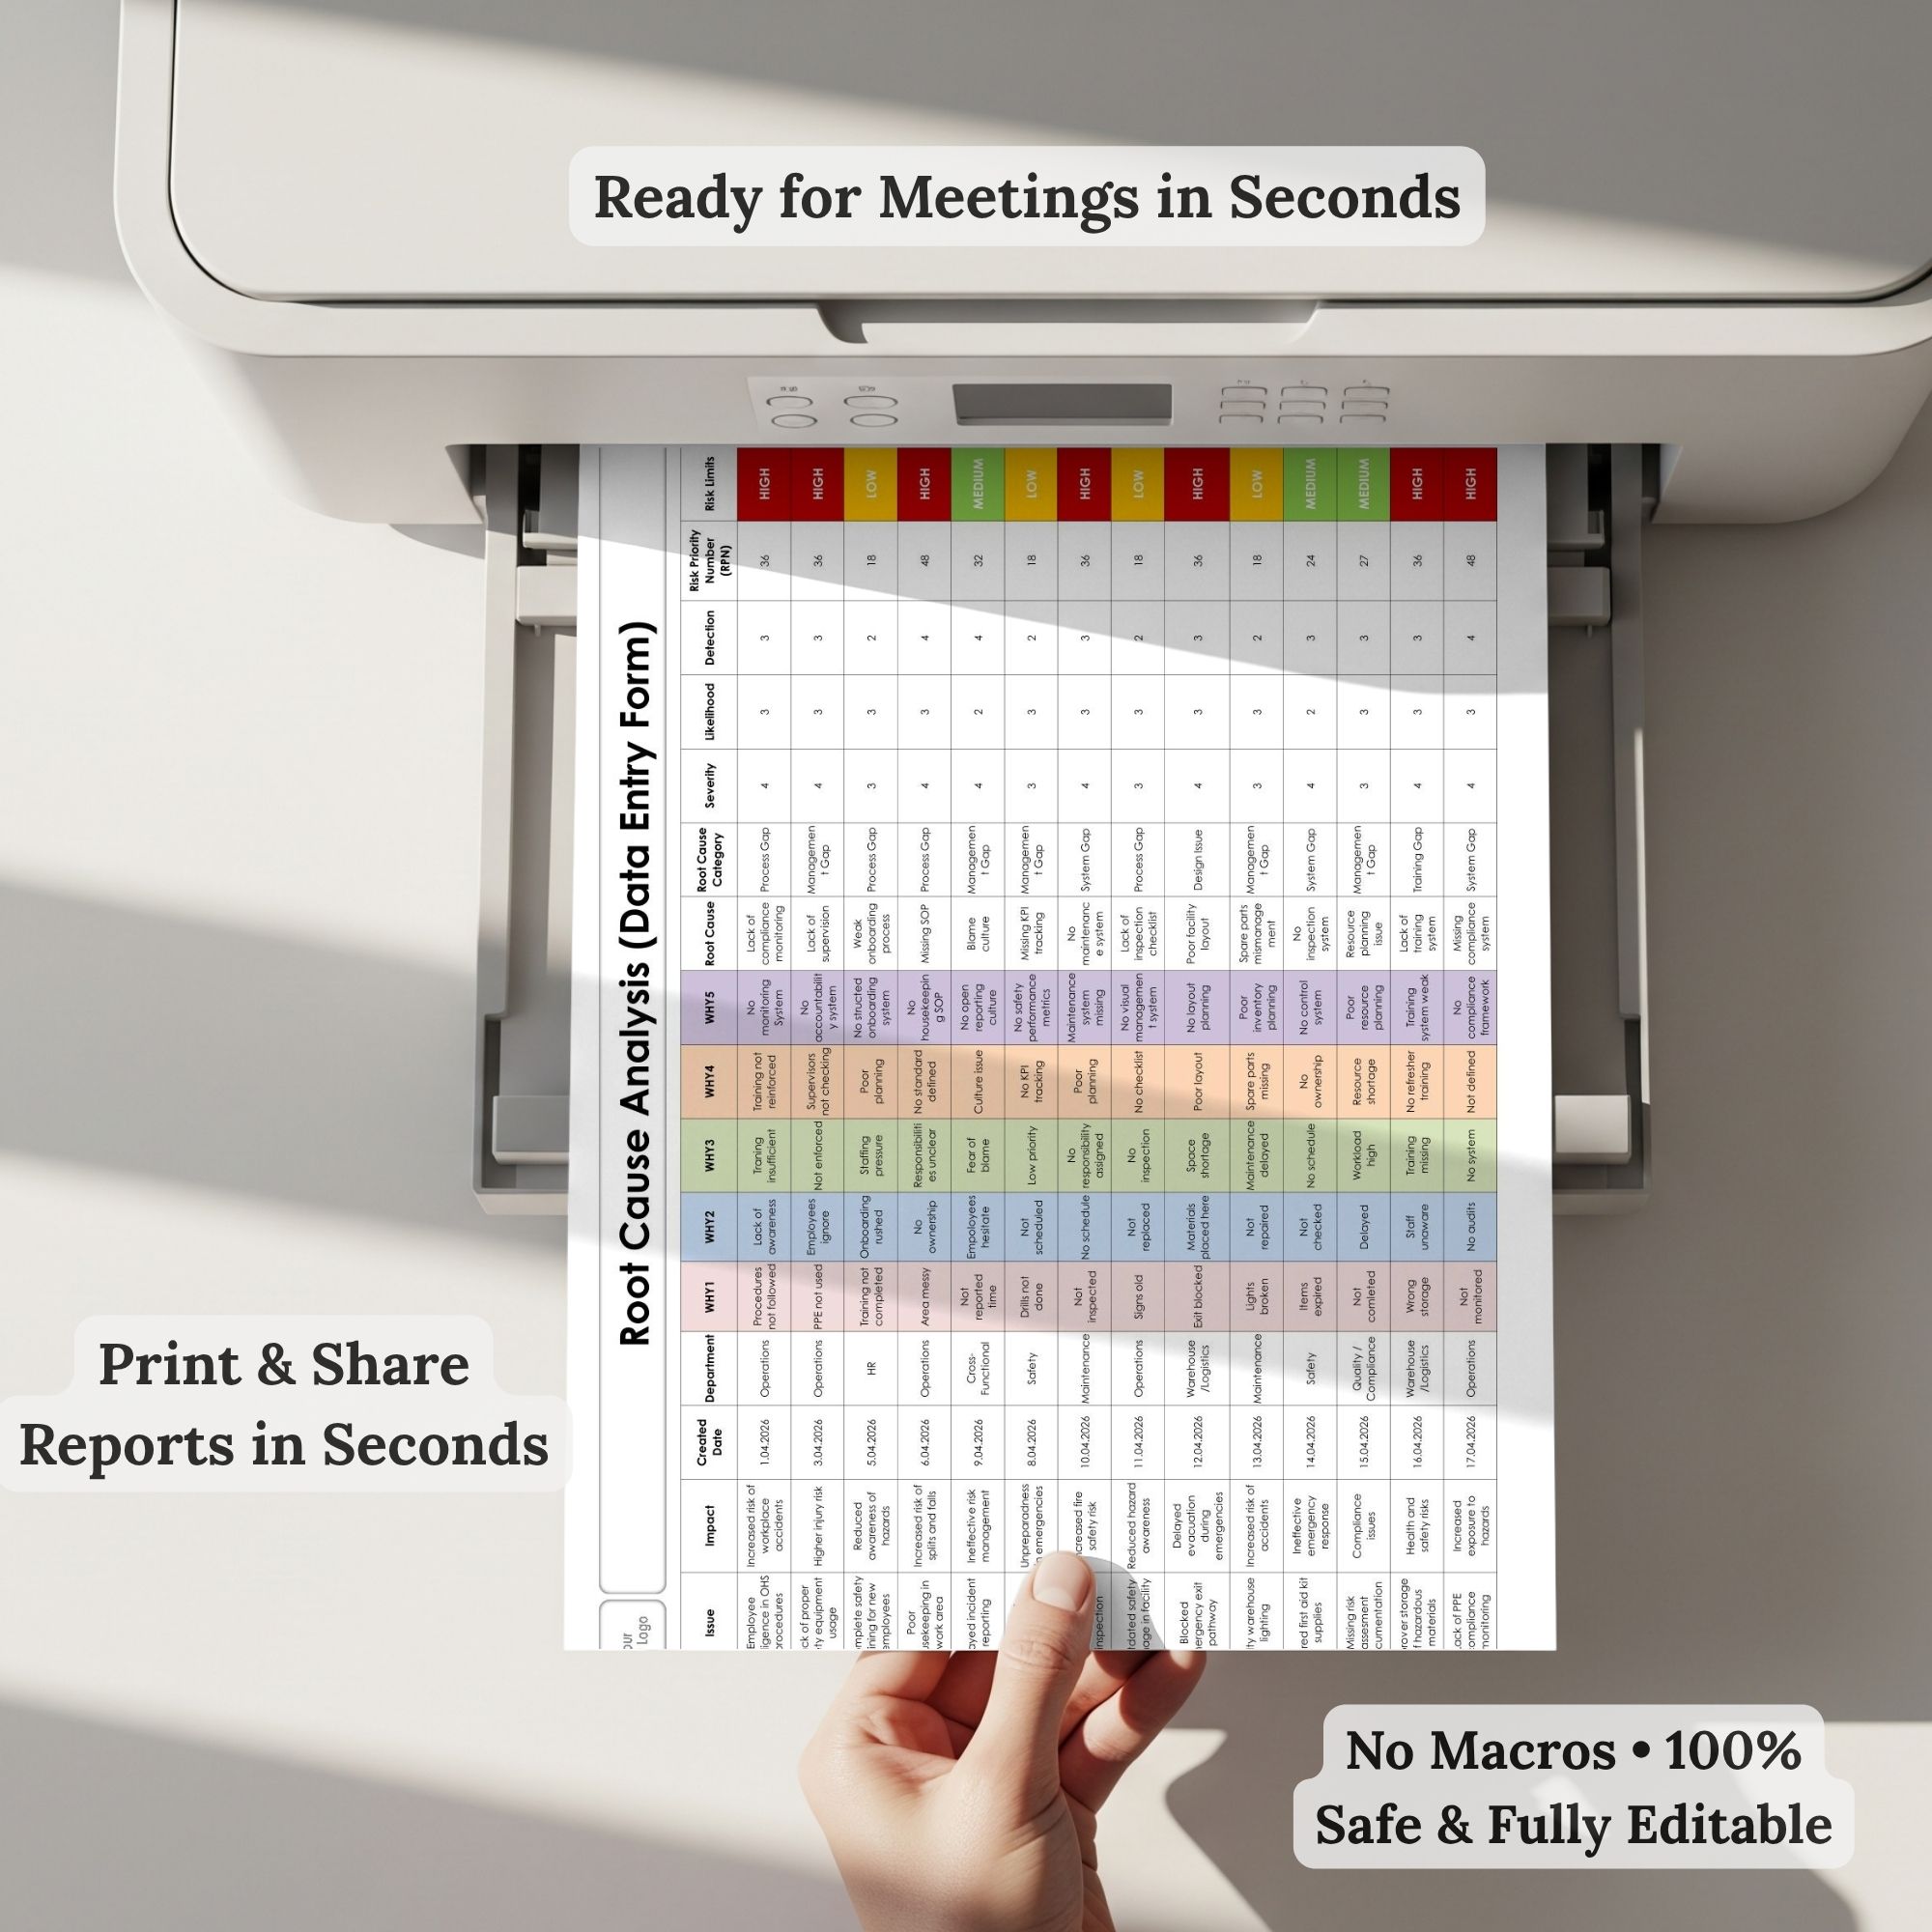
📋 Root Cause Data Form (easy data entry)
📁 Analysis Data Sheet (organized dataset)
📈 Interactive Dashboard (charts + KPIs)
📊 Pivot Tables (quick insights)
🗂 Lists Sheet (dropdowns & categories)
📘 Instructions Sheet (step-by-step guide)
—
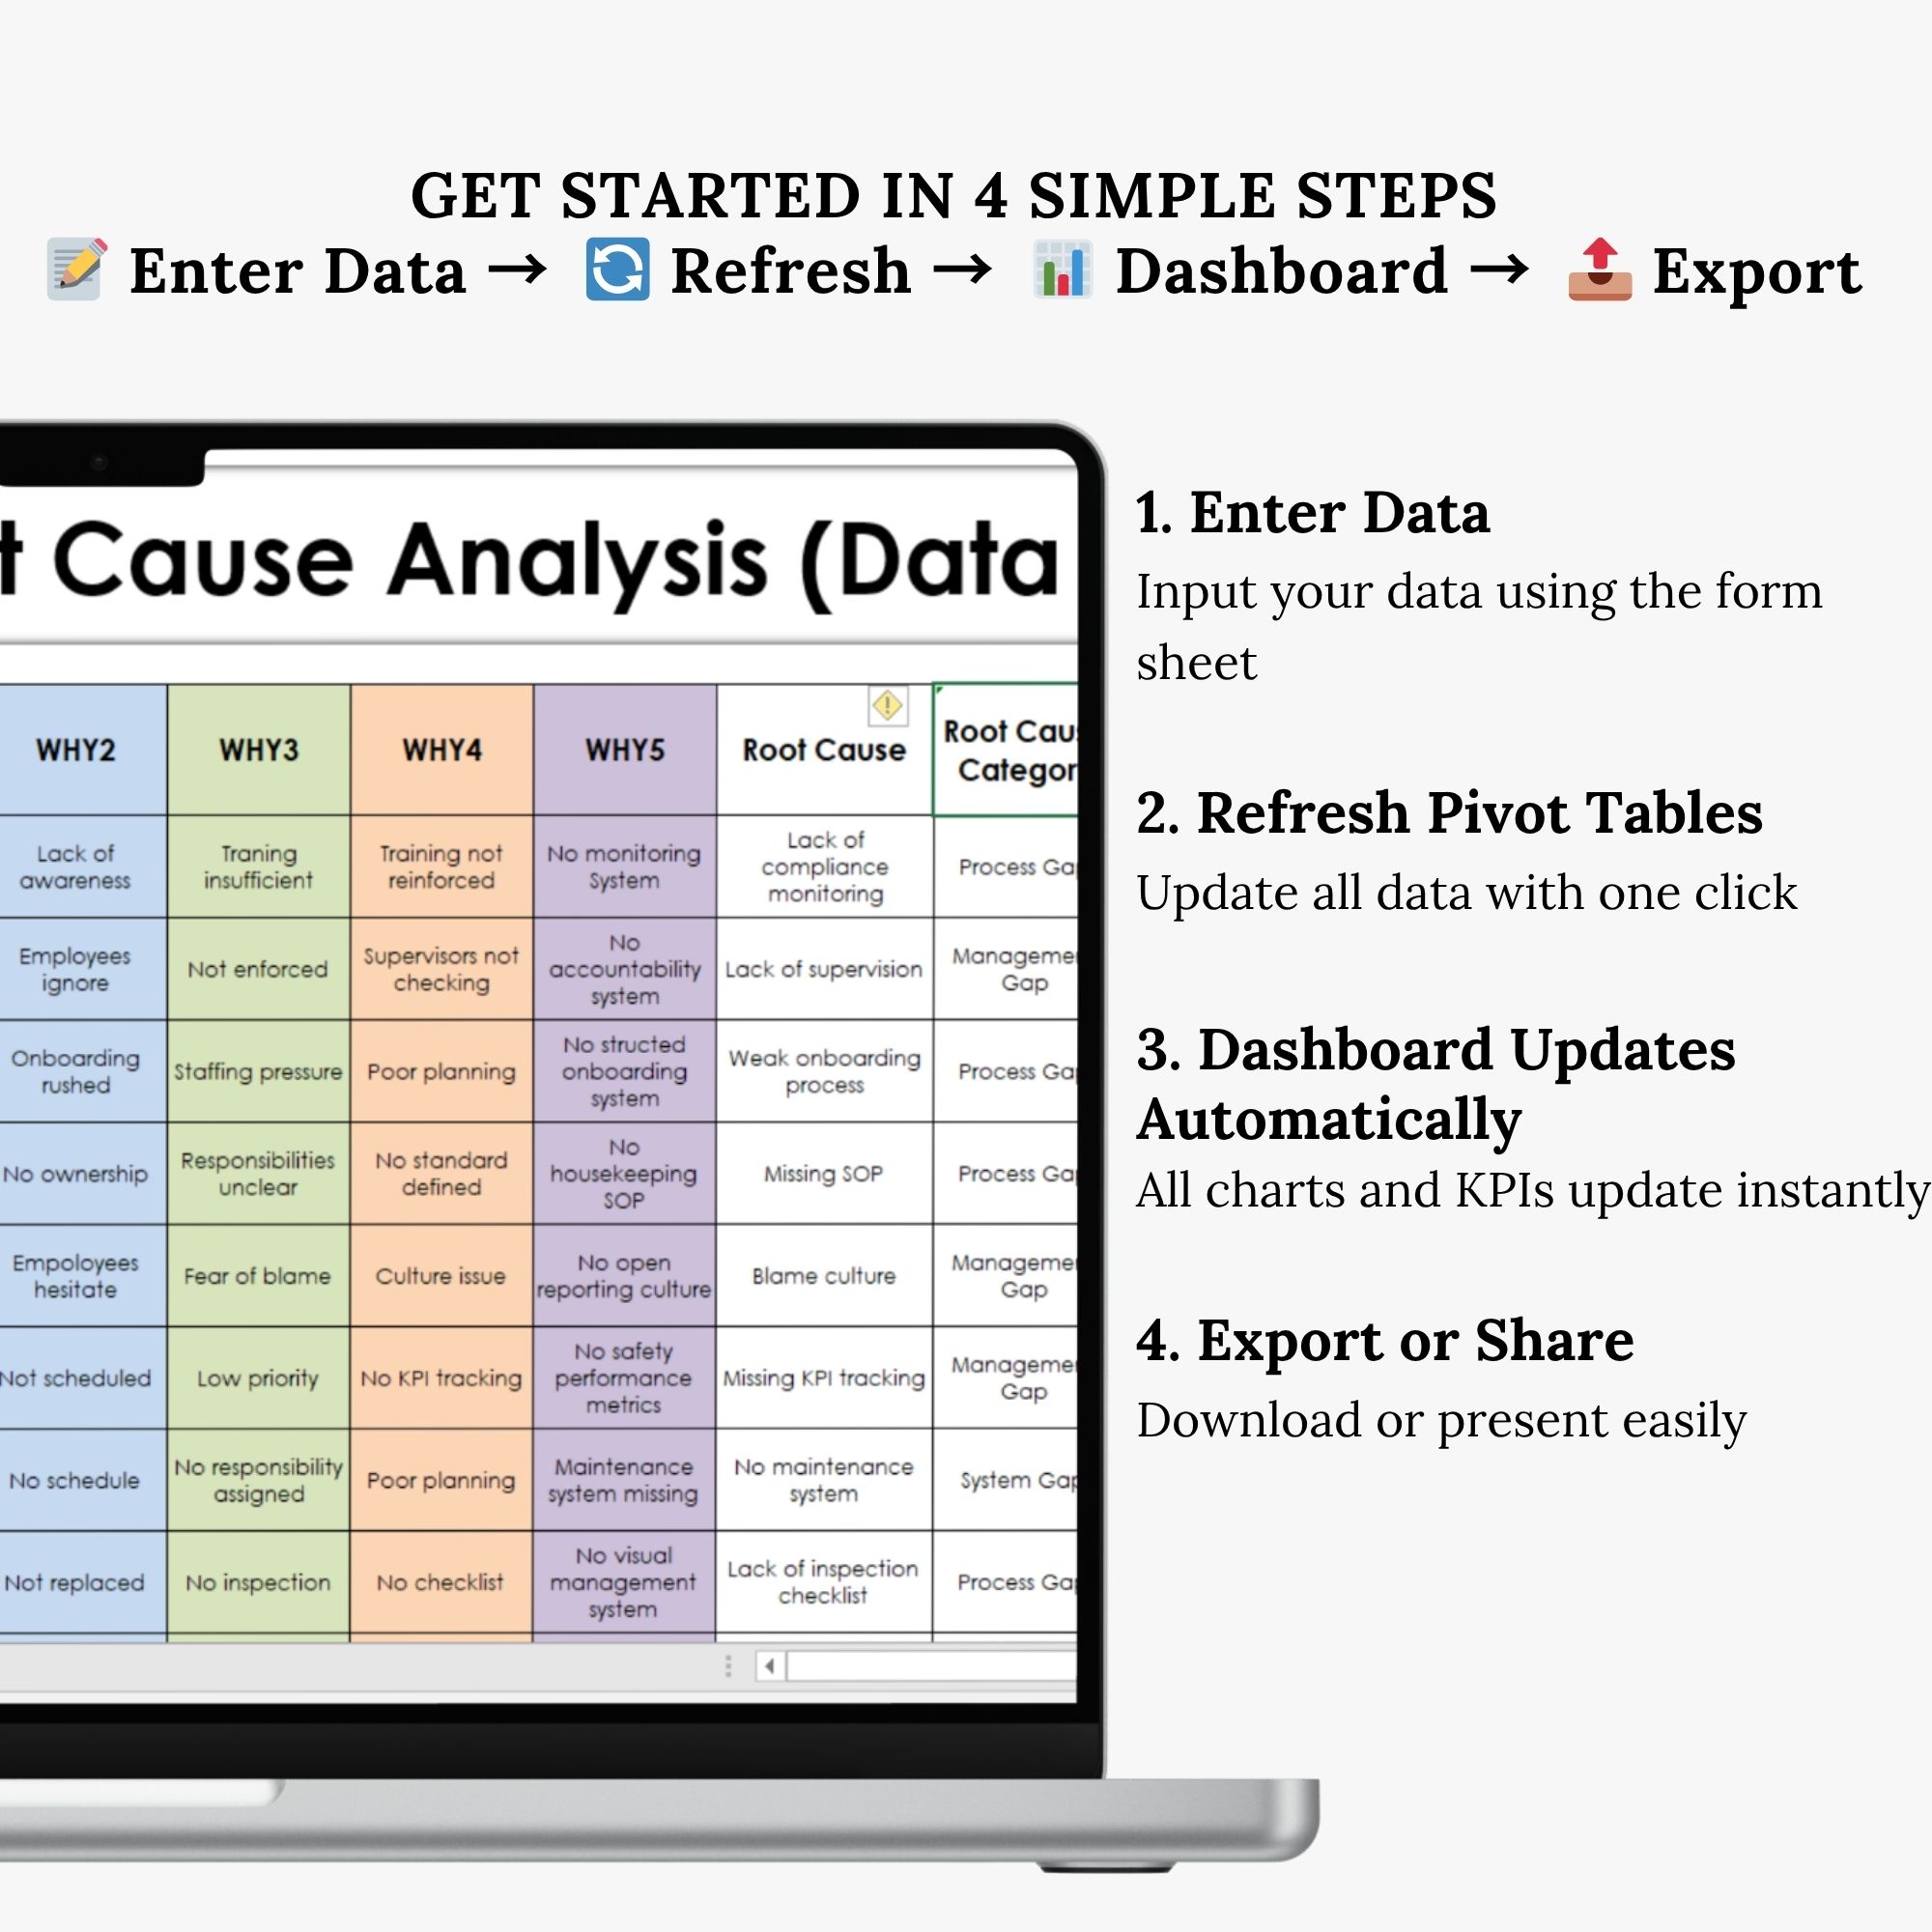
### ⚙️ HOW IT WORKS
1. Enter your data
2. Refresh pivot tables
3. Dashboard updates automatically
4. Export or present instantly
—
### 💼 PERFECT FOR
✔ Quality Managers
✔ Lean Six Sigma Professionals
✔ Operations Teams
✔ Risk & Compliance Analysts
✔ Manufacturing & Process Improvement
—
### 💡 WHY THIS TEMPLATE?
✔ Save hours of manual analysis
✔ Easily identify high-risk issues
✔ Make faster, data-driven decisions
✔ Create presentation-ready reports
—
### 🔐 SAFE & EASY
✔ No macros
✔ 100% editable
✔ Works in Excel
—
Start analyzing smarter and make better decisions — faster.


Değerlendirmeler
Henüz değerlendirme yapılmadı.